


FXOpen

A mixed picture for the two cryptos we cover on Tuesdays. While Bitcoin continued to make gains and ended its downtrend, LTC lost some ground this week.
Bitcoin Downtrend Over
The short-lived bitcoin downtrend is over. Prices broke above the important $4,103 swing high last Wednesday. It’s currently quoted at $4,257 dollars per coin, a gain of $327 dollars or just over 8 percent.
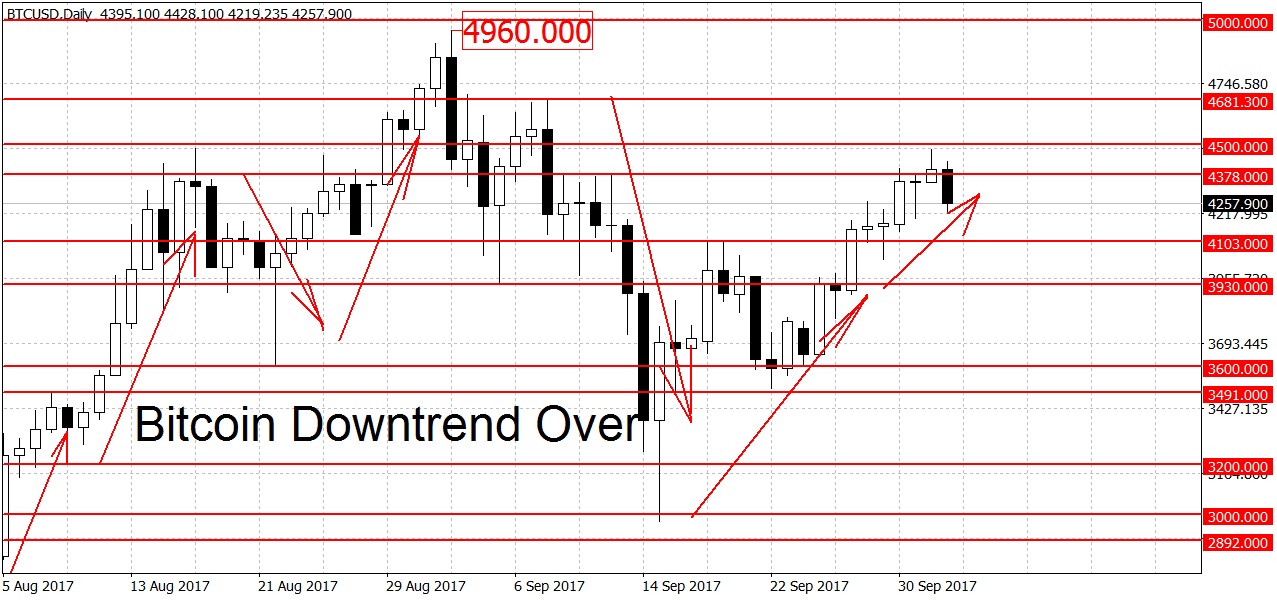
We are now trading in a large range on the daily charts. The bulls need to clear the $4,500 round figure before a new uptrend can commence. Aside from the round figure, around here we find two previous swing highs at $4,482 and recently at $4,476. A decisive breakout above $4,500 could open the door to a retest of the $5,000 round figure. The all-time high on FXOpen stands at $4,960 with other major exchanges peaking closer to the $5,000 level. A break of this important round level could lead to stronger gains.
On the lower end, the bears need a break below the $2,970 swing low. A move below here would technically restart the downtrend. Support higher up can be found in the $3,500 – $3,510 area, followed by the $4,000 round figure. The large gap between the two key levels ($2,970 and $4,500) shows just how volatile things have been recently. Due to this, it’s recommended that traders utilize smaller than usual trade sizes. While range-bound on the daily, BTC/USD is still looking bullish on the weekly and monthly charts.
Litecoin Slightly Down
Despite the gains in BTC, Litecoin traded slightly down this week. We’re currently quoted at $51.55 dollars per coin, down by $1.16 since last Tuesday. In percentage terms, this is 2.2%.
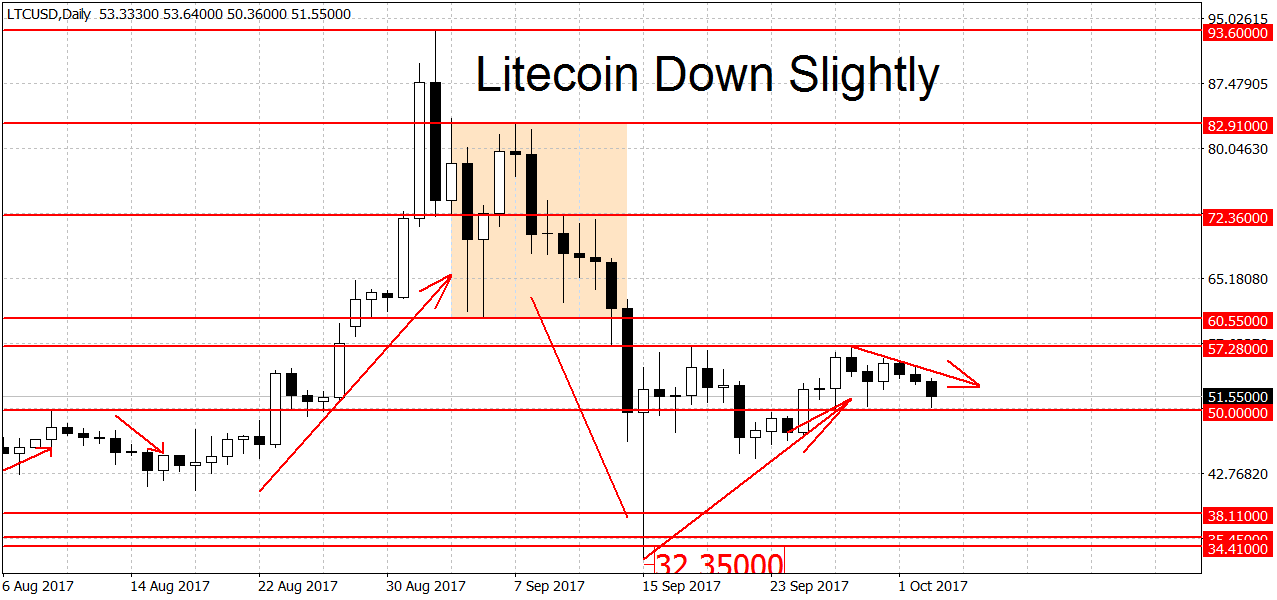
While LTC/USD briefly peaked above the $57.28 swing high, the move higher ended at $57.32. This means that the downtrend is still in place. As usual with these levels, we’re looking for a decisive breakout, not just a quick and shallow spike.
The double top at $57.28 – $57.32 is now the now key level to watch. A breakout above here would end the bear market on the daily charts. A move higher up above $63 dollars would start a new rally in prices.
We have potential support on the way down at the $50 round figure, followed by the $44.47 and $40.74 swing lows. A break below the $40 round figure could open the door to the crash lows at $32.35 dollars. On the weekly charts, LTC/USD is still in range. The monthly chart is looking bullish.
Bitcoin forex trading on Crypto accounts with FXOpen broker.
FXOpen offers the world's most popular cryptocurrency CFDs*, including Bitcoin and Ethereum. Floating spreads, 1:2 leverage — at your service. Open your trading account now or learn more about crypto CFD trading with FXOpen.
*At FXOpen UK and FXOpen AU, Cryptocurrency CFDs are only available for trading by those clients categorised as Professional clients under FCA Rules and Professional clients under ASIC Rules respectively. They are not available for trading by Retail clients.
This article represents the opinion of the Companies operating under the FXOpen brand only. It is not to be construed as an offer, solicitation, or recommendation with respect to products and services provided by the Companies operating under the FXOpen brand, nor is it to be considered financial advice.
Latest articles

Weekly Market Wrap With Gary Thomson: S&P500, US Dollar, Gold Price, PEP Stocks
Get he latest scoop on the week's hottest headlines, all in one convenient video. Join Gary Thomson, the COO of FXOpen UK, as he breaks down the most significant news reports and shares his expert insights. Read the latest news

The Price of Silver Has Reached Its Highest Level in Over Three Years
As indicated by the XAG/USD chart today, the intraday price of silver reached $29.84 per ounce yesterday, while the previous yearly high on 12 April was $29.79. The last time this price was seen was in February

What Is the Wolfe Wave, and How Can You Trade It?
The Wolfe Waves is a powerful chart pattern recognised for analysing potential price reversals. Named after Bill Wolfe, who developed this formation through extensive trading practice, Wolfe Waves provide traders with a structured approach to anticipate market movements. In this