


FXOpen
The already tight range in BTC/USD narrowed further in the last seven days. We are quoted at $6,518 dollars right now, only down 26 dollars since our last update.
Bitcoin Trading Range Narrows Further
As noted above, the trading range has narrowed even further. The high during the past seven days stands at $6,731 while the low is at $6,479 dollars. Prices have been aimlessly bouncing around in this tight area.
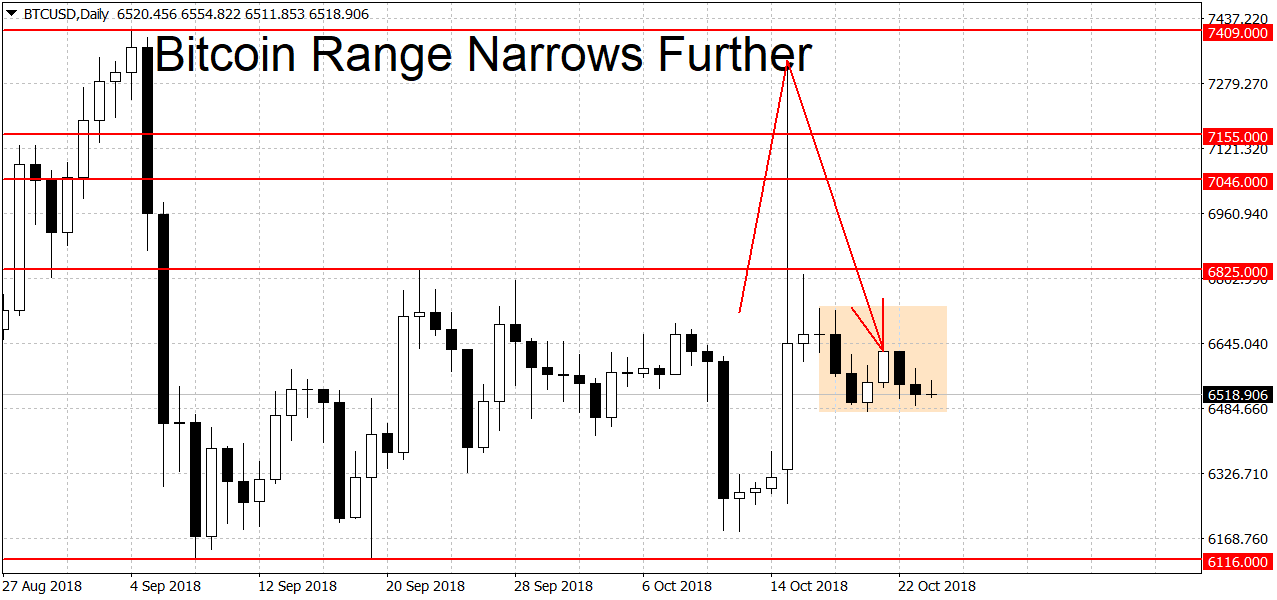
This will not last forever of course. Tight ranges are usually followed by a surge of price action. During quiet times like these, inexperienced traders usually increase their trading size to compensate for the lack of volatility and try to scalp the range. After the market breaks out, many traders who were busy buying lows and selling highs get ‘caught’ on the wrong foot and have to close their oversized positions quickly. This can trigger a snowball reaction as panicked traders rush to the door at the same time.
The levels we’re looking at are $6,825 on the upside and $6,116 on the downside. A decisive breakout above/below these levels could lead to an extended move higher/lower. Some exchanges are still experiencing Tether price dislocation. The troubled ‘stablecoin’ is currently quoted at $0.9748 on Kraken and has been trading noticeably below the $1 peg for two weeks now. You can read more about why this is happening and how to adjust your chart analysis in our previous article.
On the long-term charts the situation is unchanged, Bitcoin is slightly bearish on the weeklies and slightly bullish on the monthlies.
Litecoin Above Support
Similarly to bitcoin, LTC is also in range. But here litecoin prices are just barely holding above important support level. We are trading at $52,87 dollars right now.
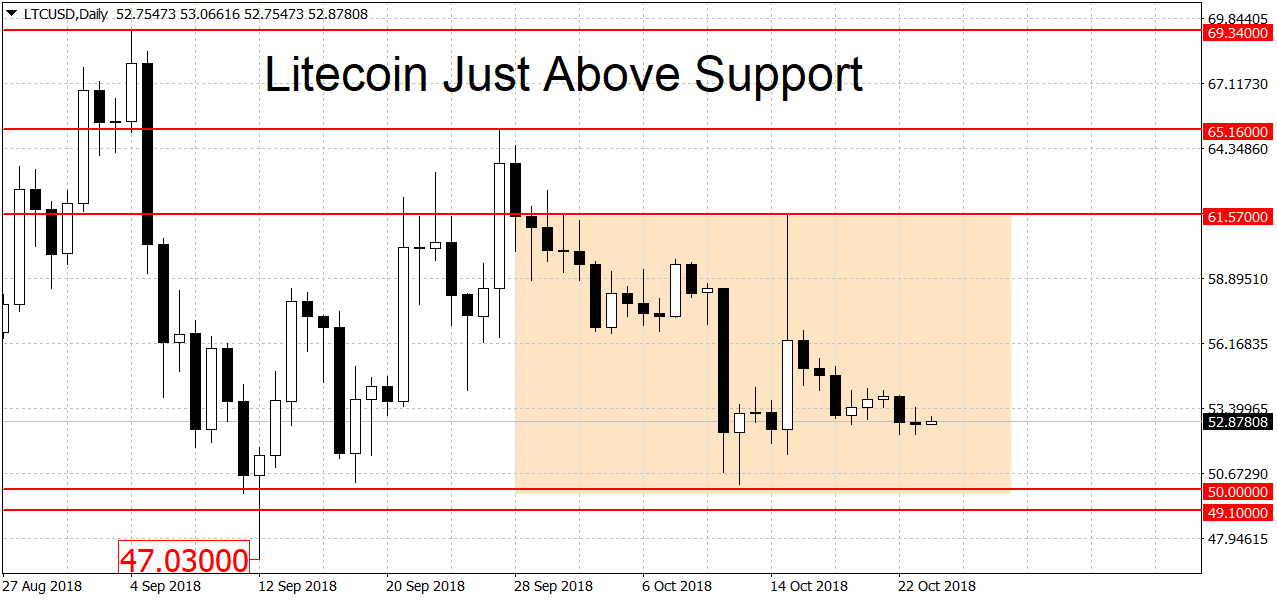
The breakdown level that could re-start the downtrend is at $50 dollars on FXOpen. Below here there’s support around $47.03, the low for this year. Higher up the milestone is around the $61.57 spike high (hit during Tether panic). A breakout above it could start a new rally.
However as we learned last week, you should be careful while entering long trades in this climate. Make sure that the price isn’t rallying due to another Tether or Bitfinex panic. You can mostly judge this by looking at the price of Tether and see if it’s trading near it’s $1 peg. During the last mini-crisis prices briefly hit 85 cents before stabilizing. Another way to judge is to compare the bitcoin price with regular exchanges like Bitstamp or Coinbase. A significant price diversion with these two signals that we may have another fake rally.
FXOpen offers the world's most popular cryptocurrency CFDs*, including Bitcoin and Ethereum. Floating spreads, 1:2 leverage — at your service. Open your trading account now or learn more about crypto CFD trading with FXOpen.
*At FXOpen UK and FXOpen AU, Cryptocurrency CFDs are only available for trading by those clients categorised as Professional clients under FCA Rules and Professional clients under ASIC Rules respectively. They are not available for trading by Retail clients.
This article represents the opinion of the Companies operating under the FXOpen brand only. It is not to be construed as an offer, solicitation, or recommendation with respect to products and services provided by the Companies operating under the FXOpen brand, nor is it to be considered financial advice.
Latest articles

Anchored VWAP and How You Can Use It in Forex Trading
In the world of forex trading, understanding the nuanced tools at your disposal can significantly enhance decision-making processes. One such sophisticated tool is the Anchored Volume-Weighted Average Price (Anchored VWAP), which refines the standard VWAP by allowing traders to set

META Share Price Collapses after Publication of Quarterly Report
Just yesterday, META's stock price closed at USD 493.50, up approximately 40% since the start of 2024 and up nearly 300% since the start of 2023.
However, following the release of Meta's quarterly report, its shares plummeted to USD

USD/JPY Analysis: The Rate Exceeds The Level of 155 Yen Per US Dollar
Today, the price of USD/JPY once again renewed its 34-year high, exceeding the level of 155 yen per dollar, which put pressure on the current authorities.
According to Reuters, officials are trying to maintain calm in the market.
"We