


FXOpen
The price of bitcoin is still stuck in a range. We are quoted at $6,557 dollars at the moment.
Bitcoin Still Stuck in Range
As noted above bitcoin is still stuck in a range for 23 days now. The top of this range is at $6,825 dollars while the bottom is at $6,116 dollars.
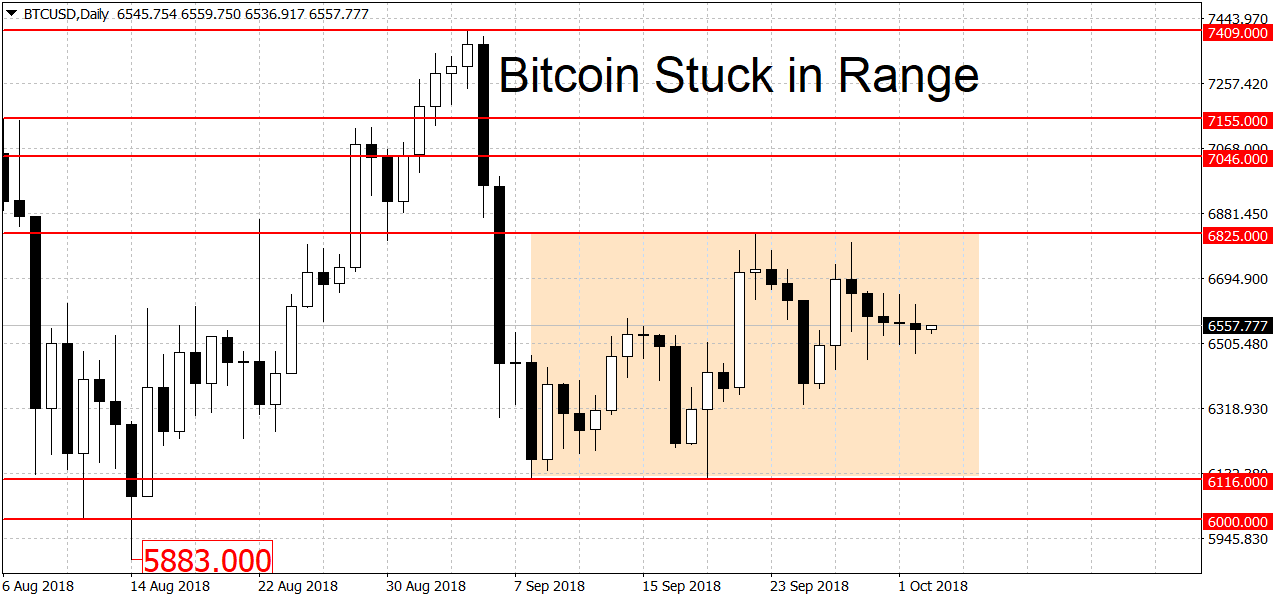
On the chart above this range is clearly marked with a yellow rectangle. There will be no clear trend on the daily chart until we get a decisive breakout beyond the top or bottom. Similarly to the price action, things have been slow on the news front too.
Weak support below can be found at the $6,000 round figure followed by the last major swing low at $5,883 dollars. We have a much stronger level at this year’s low of $5,790 dollars.
The $5,700 to $6,000 area is a triple-bottom for BTC/USD. This year we already got three bounces here in February, June and August. A clearing of this area could stop-out a lot of people and thus quickly lead to a test of the $5,000 round figure. There’s no change in trends on the longer-term charts either. Bitcoin is slightly bearish on the weeklies and slightly bullish on the monthlies.
Litecoin Back in Range
After a sizeable bounce Litecoin ended the downtrend and is now back in a range. The coin is quoted at $59.18 dollars at the moment. A breakout above $65.16 dollars is needed for a new uptrend. A move below this year’s low at $47.03 would re-start the downtrend. In the altcoin world a lot depends on what happens with big brother bitcoin, so make sure to follow price developments over there as well.
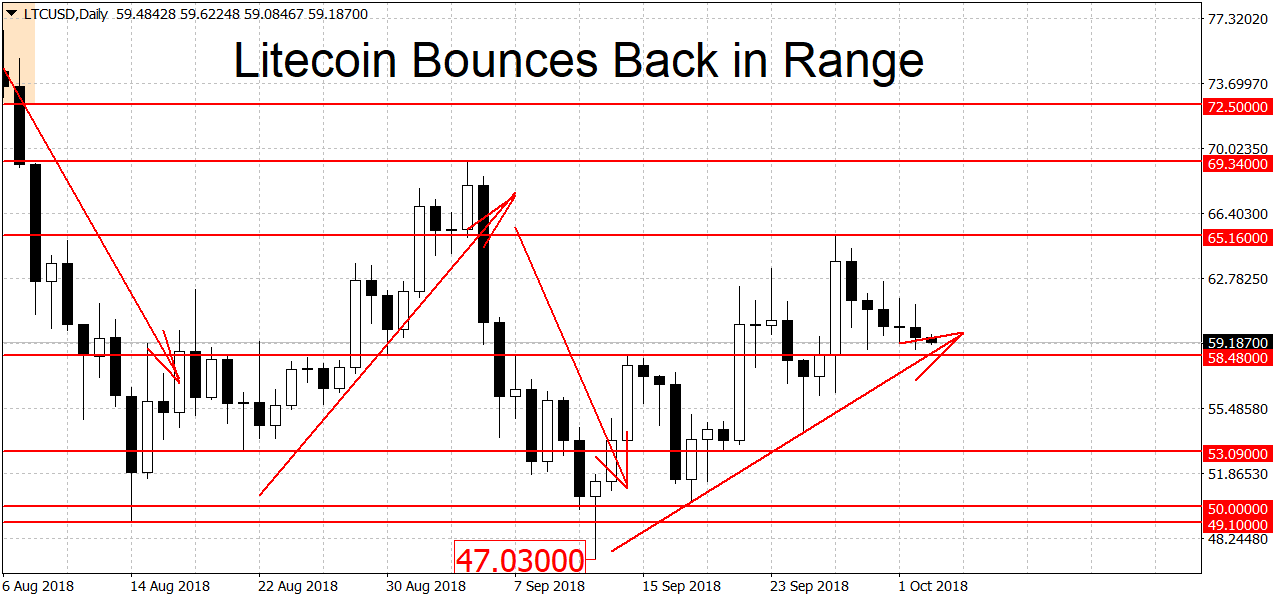
Weak support on the way down can be found at $53.09 dollars followed by the $50 round figure. The area around $50 dollars is expected to be a major battling ground between the bears and the bulls. The 2013 high for LTC/USD was at $48.40 dollars, a level that wasn’t broken until last year. This year’s low at $47.03 is another notable level. A clean break below here could lead to extended LTC losses.
Higher up there’s resistance at $65.16 dollars followed by $69.34 and $72.50 dollars. On the longer-term charts Litecoin is bearish on the weeklies and neutral on the monthlies.
FXOpen offers the world's most popular cryptocurrency CFDs*, including Bitcoin and Ethereum. Floating spreads, 1:2 leverage — at your service. Open your trading account now or learn more about crypto CFD trading with FXOpen.
*At FXOpen UK and FXOpen AU, Cryptocurrency CFDs are only available for trading by those clients categorised as Professional clients under FCA Rules and Professional clients under ASIC Rules respectively. They are not available for trading by Retail clients.
This article represents the opinion of the Companies operating under the FXOpen brand only. It is not to be construed as an offer, solicitation, or recommendation with respect to products and services provided by the Companies operating under the FXOpen brand, nor is it to be considered financial advice.
Latest from Cryptocurrencies
Latest articles

What Order Imbalance Is and How To Use It in a Trading Strategy
Understanding the nuances of order imbalances is key for traders looking to navigate the ebb and flow of asset prices. Order imbalances provide a clear window into the supply and demand dynamics at play, offering strategic insights. This article delves

XAU/USD Gold Price Reaches an Important Resistance Zone
The XAU/USD gold chart today indicates that the historical record price of the metal is above USD 2,400 per ounce.
In addition to fears of a new round of inflation due to rising commodity prices, geopolitical tensions are

What Is a Break of Structure and How Can You Trade It?
In the ever-evolving world of Smart Money Concept (SMC) trading, a nuanced understanding of market dynamics is indispensable. This article explores the concept of Break of Structure (BOS), how to identify it, and its implications for trading strategies, setting traders