


FXOpen
The range in BTC/USD continued during the past week. This wasn’t much of a surprise considering that the period included the Christmas and New Year Holidays. Litecoin is trading little changed, currently quoted at $257 from $263 dollars last week.
Bitcoin Range Continues
After ending the rally on December 22nd bitcoin remained in a range. The top of this range is at $19,850 all-time high while the low is at the latest major swing low of $10,680. A break beyond either of these price extremes could usher in the new trend. For now we remain in ‘wait and see’ mode.
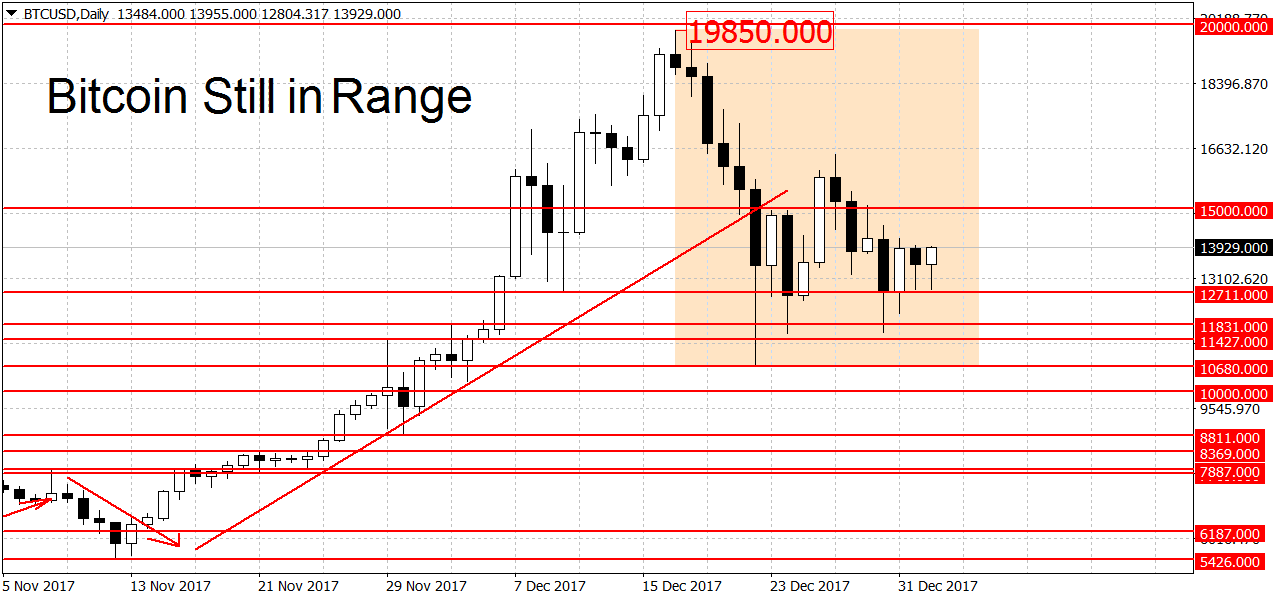
On the upside, we have weak resistance at the $15,000 round figure, followed by the latest swing high at $16,470 dollars. Higher still we have two weaker levels at the former swing highs of $17,147 and $17,547 dollars. A major resistance area can be found near the all-time high at $19,850 extending to the $20,000 round figure. A decisive breakout above this important milestone should lead to a new bullish trend on the daily chart.
Support on the way down can be found at $12,711 followed by $11,591 dollars. As noted above the $10,680 swing low is a potential downtrend starter. Further down we have the $10,000 round figure, which may act as support to falling prices. On the longer-term weekly and monthly charts, BTC remains in an uptrend.
Yesterday’s Gemini auction had a volume of only 0.07 BTC, signalling that most of the market checked out for the holidays. As market participants slowly return from the festivities we should see a pick up of volume and hopefully some directional moves.
Litecoin Trading Flat
Litecoin is trading mostly flat as well. It’s currently quoted at $257 dollars, down from $263 dollars during our last update. This is a drop of 2.2 percent, a negligible amount for a crypto-currency.
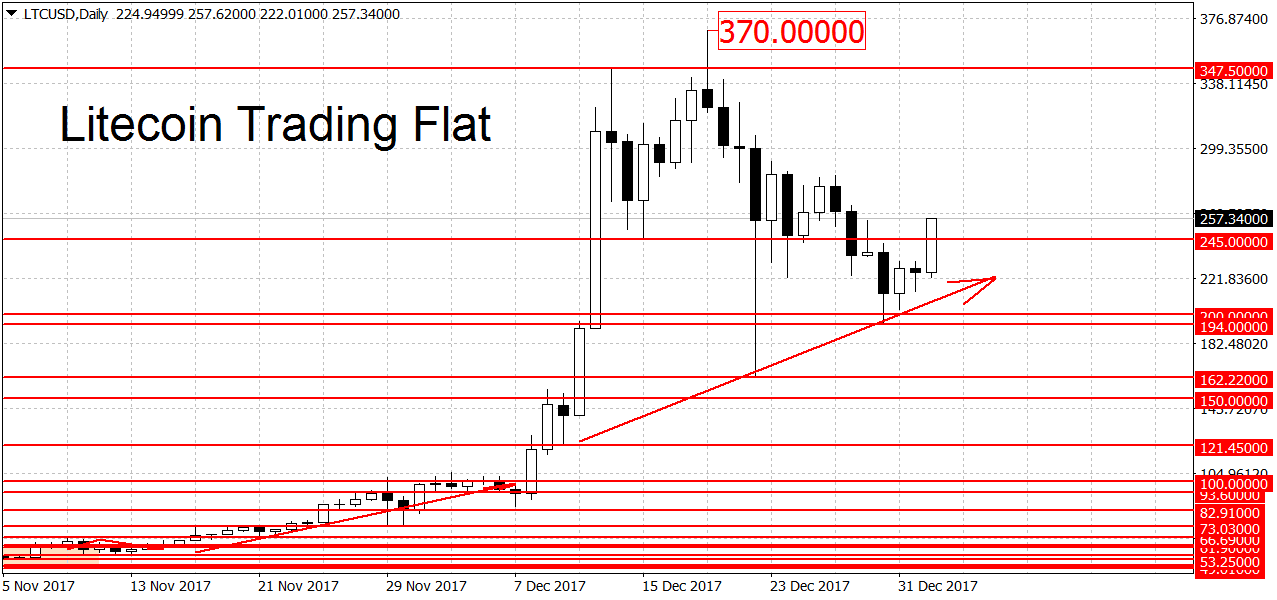
Unlike bitcoin, LTC/USD remains in an uptrend on the daily. To end it the bears will have to push prices below the latest swing low at $194 dollars. Slightly above here we have more support at the $200 round figure and the $245 level.
Resistance can be found at the $300 round figure, followed by the $347.50 swing high and $350 dollars. Naturally the all-time high at $370 dollars is another potential resistance. A breakout above it may accelerate the gains. Similarly to BTC, on the longer-term weekly and monthly charts LTC is looking bullish.
FXOpen offers the world's most popular cryptocurrency CFDs*, including Bitcoin and Ethereum. Floating spreads, 1:2 leverage — at your service. Open your trading account now or learn more about crypto CFD trading with FXOpen.
*At FXOpen UK and FXOpen AU, Cryptocurrency CFDs are only available for trading by those clients categorised as Professional clients under FCA Rules and Professional clients under ASIC Rules respectively. They are not available for trading by Retail clients.
This article represents the opinion of the Companies operating under the FXOpen brand only. It is not to be construed as an offer, solicitation, or recommendation with respect to products and services provided by the Companies operating under the FXOpen brand, nor is it to be considered financial advice.
Latest from Cryptocurrencies
Latest articles

UK100 Share Index Rises as UK Inflation Slows
Yesterday, the UK Office for National Statistics (ONS) reported that the CPI stood at 3.2% in March. According to ForexFactory, analysts expected 3.1%, and a month ago the index was 3.4%.
Grant Fitzner, chief economist at the

The Dollar is Corrected after the Comments of the Head of the Federal Reserve
Good data on the labour market in the United States and the continuous rise in inflation for several months are helping to reduce experts’ expectations about a change in the vector of monetary policy in the United States. Recent comments

Is There the Best Time to Trade Stock CFDs?
If you ask experienced traders, many will say that they trade on certain days or at certain times of the day. Their choice is determined by the market dynamics, volatility, and liquidity. It’s crucial to understand when the best