


FXOpen
The bitcoin rally ended during the weekend as prices broke the $423 swing low. Meanwhile its little brother Litecoin stayed range-bound for another week.
Bitcoin Rally Ends
The (almost) month-long BTC rally looks to be finally winding down after we broke below $423 on Saturday. In our last article on Thursday we noted this level as a potential game changer. After the bears broke this figure we saw BTC/USD fall all the way to $401.15 dollars per coin.
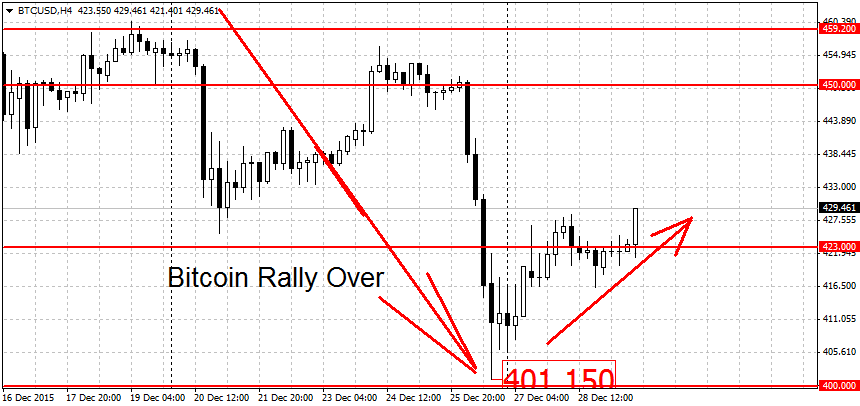
We have since bounced back somewhat with bitcoin moving up to $429.46 dollars at the moment. Despite the gains, it will take a lot more to restart the rally. For that to happen, the bulls may have to take out prices all the way back to $460 dollars. Higher up the first major resistance can be found at the round $500 figure. This is close to where the previous November rally topped out at $504 dollars on most BTC exchanges.
On the lower end, a decisive break of the $400 round figure could start a new downtrend for bitcoin. But caution is advised in these circumstances. After large rallies or downtrends, the market usually needs some time to digest the new reality. Prices rarely switch from one state to the other, i.e. uptrend to downtrend, without some consolidation in between.
Notable support levels below $400 are the $379 swing high, followed by the $350 round figure. Weaker levels below can be found near $340 and $310 dollars per coin.
Litecoin Still Range-bound
After Litecoin ended its rally last week, we’ve continued to trade range-bound. We are currently quoted at $3.49 dollars, in the middle of last week’s range. Litecoin traded as high as $3.64 dollars and as low as $3.35 dollars during the past seven days.
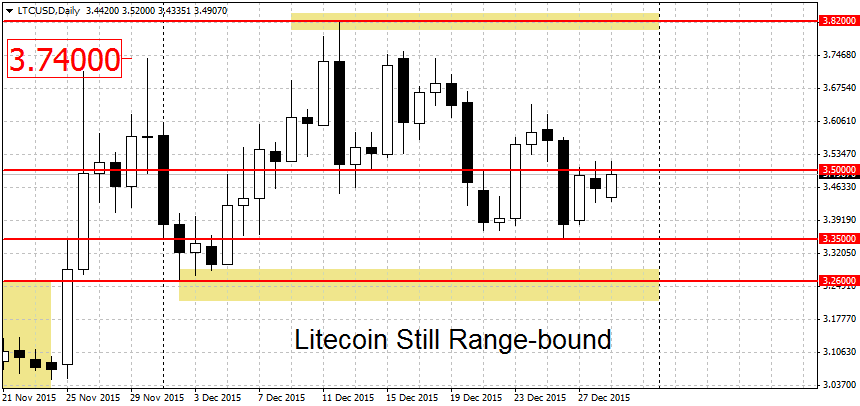
No important levels have been breached yet. A potential rally starting point is the $3.82 swing high. A decisive breakout above this level may trigger a new uptrend. Higher up resistance can be found at $4.00 and $4.50 dollars, followed by the November high at $4.85 dollars.
On the downside we have some support at the $3.35 dollars figure. But the more important level is near $3.26 dollars per coin. A clean breakdown below here could start a new LTC downtrend. The first support below here can be found at the round $3 dollars, followed by the $2.88 swing low. Below here we have more support at $2.70 and $2.50 dollars per coin. We end the notable LTC levels on the downside with the January swing high at $2.40 dollars and the $2 round figure.
FXOpen offers the world's most popular cryptocurrency CFDs*, including Bitcoin and Ethereum. Floating spreads, 1:2 leverage — at your service. Open your trading account now or learn more about crypto CFD trading with FXOpen.
*At FXOpen UK and FXOpen AU, Cryptocurrency CFDs are only available for trading by those clients categorised as Professional clients under FCA Rules and Professional clients under ASIC Rules respectively. They are not available for trading by Retail clients.
This article represents the opinion of the Companies operating under the FXOpen brand only. It is not to be construed as an offer, solicitation, or recommendation with respect to products and services provided by the Companies operating under the FXOpen brand, nor is it to be considered financial advice.
Latest articles

Anchored VWAP and How You Can Use It in Forex Trading
In the world of forex trading, understanding the nuanced tools at your disposal can significantly enhance decision-making processes. One such sophisticated tool is the Anchored Volume-Weighted Average Price (Anchored VWAP), which refines the standard VWAP by allowing traders to set

META Share Price Collapses after Publication of Quarterly Report
Just yesterday, META's stock price closed at USD 493.50, up approximately 40% since the start of 2024 and up nearly 300% since the start of 2023.
However, following the release of Meta's quarterly report, its shares plummeted to USD

USD/JPY Analysis: The Rate Exceeds The Level of 155 Yen Per US Dollar
Today, the price of USD/JPY once again renewed its 34-year high, exceeding the level of 155 yen per dollar, which put pressure on the current authorities.
According to Reuters, officials are trying to maintain calm in the market.
"We