


FXOpen

Both Bitcoin and Litecoin are trading barely changed compared to one week ago. Bitcoin is at $608 right now, only $3 above last Tuesday’s price. Its little brother Litecoin is quoted at $3.82 per coin, just 2 cents above the $3.80 price noted in our last LTC update.
Bitcoin Barely Changed
As we mentioned above, Bitcoin is trading barely changed this week. Prices have been locked between $600 and $610 on most exchanges.
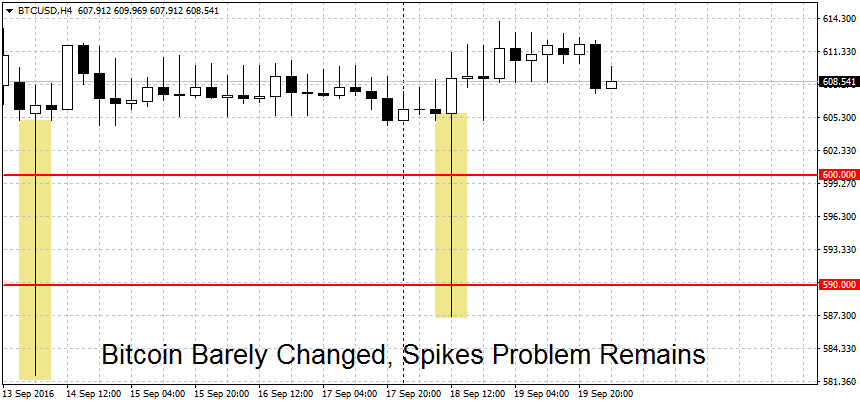
On FXOpen (and BTC-E) we traded to a low of $581 last Wednesday, but this was on a short illiquid spike. In our last BTC article we warned our readers about these spikes. Until liquidity improves or this problem is rectified, it’s a good idea to confirm FXOpen and BTC-E prices with other exchanges like BitStamp and OKCoin. Even using the prices from BTC-E main exchange should help filter out these spikes as this appears to be a problem on their MetaTrader accounts. To get BTC-E chart, you can go here and type in BTCE:BTCUSD in the search box.
With that out of the way, let’s take a look at some levels. While we’re still in a short-term uptrend, the momentum has been completely lost. To resume the upward momentum, we need to see prices break above the $628 high. A strong resistance can be found at the $650 mark. This is followed by more resistance levels at $670, $687 and $700 per coin.
A decisive break below $590 could end the uptrend. A new downtrend requires a break of the $566 swing low as well. Support below here can be found at $556 and $550 per coin.
Litecoin up by 0.52%
Litecoin is trading higher by 0.52%, from $3.80 to $3.82 per coin. Similarly to the big brother, no important levels have been breached during the past seven days. Unlike BTC, Litecoin is still without a clear trend in short-term charts.
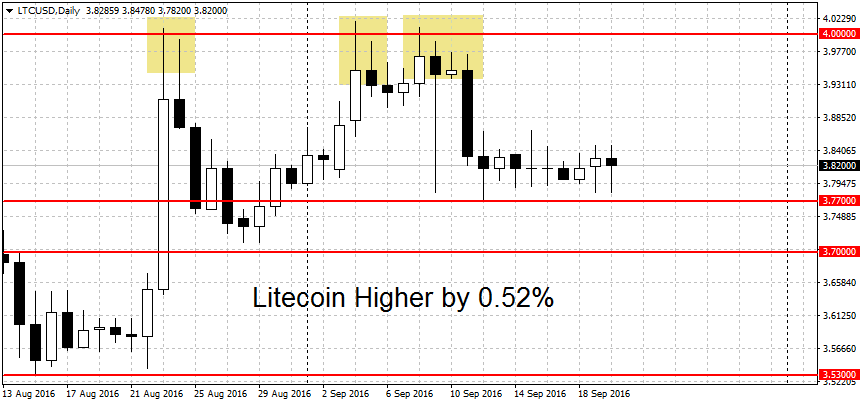
A decisive break below $3.77 could start a new LTC downtrend. Below here we find a weak support at the $3.70 level. This is followed by the $3.53 swing low and the $3.50 round figure. A clearing of this area could see us test the $3.22 lows hit in the aftermath of the Bitfinex hack. We have more support levels below at the $3 round figure, followed by this year’s low at $2.89 and the twelve-month low at $2.50 per coin.
On the other end, the $4 round figure remains to be key. A move above here is needed to spark a new short-term rally. Resistance levels above the round figure can be found at the $4.07 swing high, followed by $4.15 and the resistance area from $4.43 to $4.52 per coin.
FXOpen offers the world's most popular cryptocurrency CFDs*, including Bitcoin and Ethereum. Floating spreads, 1:2 leverage — at your service. Open your trading account now or learn more about crypto CFD trading with FXOpen.
*At FXOpen UK and FXOpen AU, Cryptocurrency CFDs are only available for trading by those clients categorised as Professional clients under FCA Rules and Professional clients under ASIC Rules respectively. They are not available for trading by Retail clients.
This article represents the opinion of the Companies operating under the FXOpen brand only. It is not to be construed as an offer, solicitation, or recommendation with respect to products and services provided by the Companies operating under the FXOpen brand, nor is it to be considered financial advice.
Latest articles

Google Share Price Rose Post-market to a New All-time Record
Yesterday, after the close of the main trading session, a report on activities for the 1st quarter of Alphabet Inc. (Google's parent company) was published. The report was strong, exceeding investors' expectations.
→ Quarterly EPS = USD 1.89 (expected = USD 1.

S&P 500 Rebounds after Negative GDP News
Data released yesterday showed US GDP growth slowed to 1.6% in the first quarter of the year. According to ForexFactory: forecast = 2.2%, past value = 2.4%.
Reaction to the news sent the S&P 500 mini stock

GBP/USD And USD/CAD Daily Chart Outlook
GBP/USD is attempting a recovery wave from 1.2300. USD/CAD is consolidating and might aim for a move above the 1.3760 resistance zone.
Important Takeaways for GBP/USD and USD/CAD Analysis Today
· The British Pound started