


FXOpen
Both bitcoin and litecoin made new all-time highs since our last update. Big brother peaked out at $4,637 dollars per coin while LTC/USD hit a high of $64.84.
Bitcoin Hits New All-Time High
The bull run in BTC/USD continues. After a period of consolidation, prices hit a new all-time high today. There was no news catalyst for the most recent gains, so it appears to be a continuation of the segwit pump.
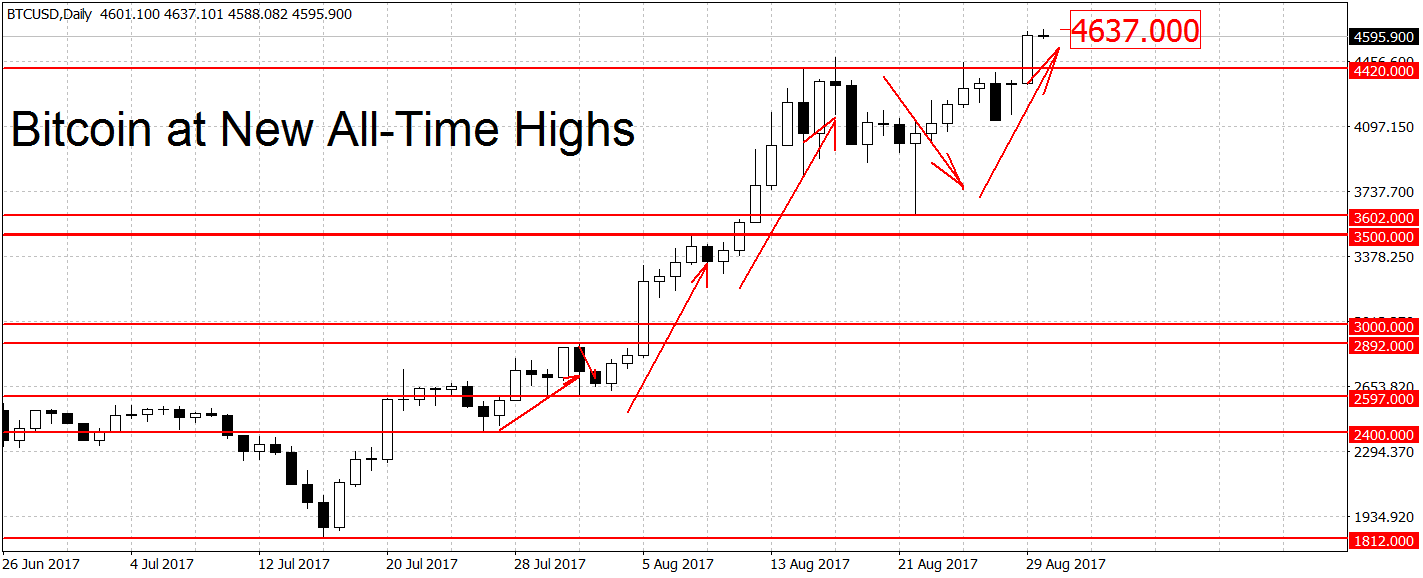
We’re currently quoted only $42 below the highs at $4,595 dollars. The uptrend started last month is still in force. Some support below here can be found at the previous highs in the $4,450 – $4,500 area. This is followed by more support at the $4,000 round figure. To end the current rally the bears will have to break below the $3,600 swing low. A move below $3,282 is needed for a new BTC downtrend.
Because we are near all-time highs, there are no notable resistance levels except the round figures like $4,800, $4,900, $5,000 etc. Out of these $5,000 should act as stronger resistance. On the longer-term weekly and monthly charts, bitcoin is in an uptrend as well.
Litecoin Finally Breaks Out
Litecoin prices finally broke out of a prolonged range. The key $52 dollars level was taken out last Wednesday. Then we got a some stalling in the $50 area before finally proceeding higher. We are currently quoted at $62.81 dollars per coin, a gain of $16.8 or 36.5 percent compared to our update one week ago.

We are now in ‘rally mode’ again. Support below current prices can be found at the previous all-time high of $53.84 followed by the $49 – $52 dollars area. While a breakdown below here should be a cause for worry to the bulls, the uptrend will technically remain in place until the $44.50 swing low is taken out as well.
Similarly to BTC/USD, because we’re near all-time highs there are no previous levels to the upside. The only levels to note are the round figures like $63, $64, $65, $70, $100 etc. Out of these potential resistance figures the most important would be $100, followed by $70 then by $65. You get the idea. Of course this is not a guarantee that price wont randomly stop in between these levels, as it often does. On the long-term weekly and monthly charts LTC/USD remains in the bullish trend started in March of this year.
Try FXOpen crypto account for bitcoin trading
FXOpen offers the world's most popular cryptocurrency CFDs*, including Bitcoin and Ethereum. Floating spreads, 1:2 leverage — at your service. Open your trading account now or learn more about crypto CFD trading with FXOpen.
*Important: At FXOpen UK, Cryptocurrency trading via CFDs is only available to our Professional clients. They are not available for trading by Retail clients. To find out more information about how this may affect you, please get in touch with our team.
This article represents the opinion of the Companies operating under the FXOpen brand only. It is not to be construed as an offer, solicitation, or recommendation with respect to products and services provided by the Companies operating under the FXOpen brand, nor is it to be considered financial advice.
Stay ahead of the market!
Subscribe now to our mailing list and receive the latest market news and insights delivered directly to your inbox.


Latest articles

Market Analysis: AUD/USD and NZD/USD Struggle to Sustain Gains—What’s Next?
AUD/USD declined below the 0.6320 and 0.6300 support levels. NZD/USD is also moving lower and might extend losses below 0.5700.
Important Takeaways for AUD/USD and NZD/USD Analysis Today
· The Aussie Dollar started a

Market Insights with Gary Thomson: UK & US Inflation, US Durable Goods Orders, and Earnings Reports
In this video, we’ll explore the key economic events, market trends, and corporate news shaping the financial landscape. Get ready for expert insights into forex, commodities, and stocks to help you navigate the week ahead. Let’s dive in!

Alphabet (GOOGL) Stock Hits 2025 Low
As seen on the Alphabet (GOOGL) stock chart, the price has dropped close to $156—a level not seen since September 2024.
Since the start of 2025, the stock has fallen by more than 18%.
Why Is GOOGL Falling?
As