


FXOpen
Bitcoin continues to trade undecided, albeit with a slight bullish bias. During the past three days prices have stabilized between a low of $370 and a high of $385. Let’s take a look at some charts.
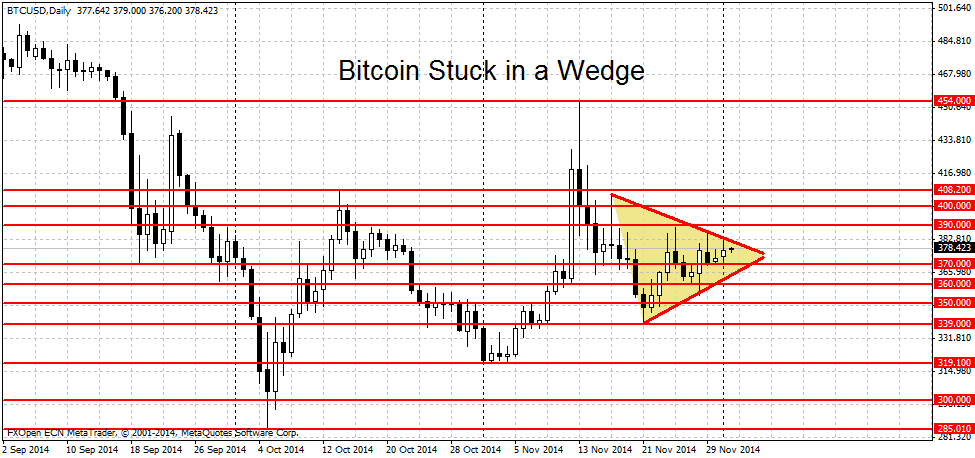
The Daily chart above shows a large wedge. The increasingly narrower trading range will eventually result in a breakout. Wedges are typically a continuation pattern but it’s hard to judge the BTC trend from the daily chart alone. For the past year, BTC/USD has been in a slow and steady slide. Since reaching a swing low of $285 on October 5th however, BTC prices have stabilized and gained back some ground.
Support/Resistance Levels
What are the breakout points for bitcoin? The descending trendline of the wedge falls around $383 per coin. But a better potential breakout level is probably $390 because right above the $383 mark we have two previous swing highs at $388.99 and $385.76. But even a breakout past $390 may not go far. We have a resistance area right above here at $400-$408 per coin. A break past $408 may extend gains toward the $450 level. A clean breakout of $450 will likely trigger a renewed bitcoin rally.
On the downside, the wedge trendline stands at $360. But similarly to the $390 mark on the topside, $360 is quickly followed by a support area that spans from $339 to $350 so losses may be limited. A breakdown past $339 however will likely lead to more losses toward $319 per coin. Further down, we fine some support at the $300 round figure, followed by the $285 swing low mentioned above.
Namecoin Stable
Alternative cryptocurrency Namecoin shows some signs of stability. In our previous article we wrote about how both PPC and LTC look weak. Peercoin is constantly pushing on $0.70 (we are quoted at $0.728 right now) while Litecoin is currently hovering above the $3.40 mark at $3.55. But unlike these two, NMC more or less held up its own.
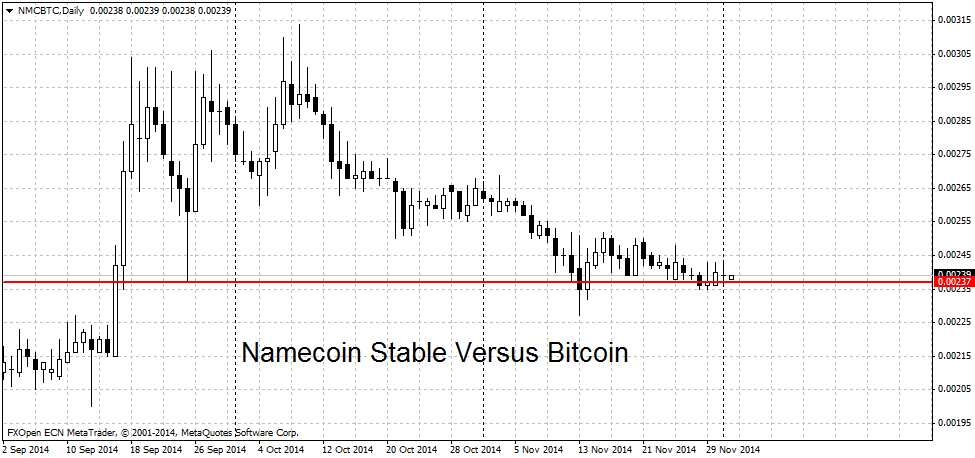
The chart above shows Namecoin compared to Big Brother Bitcoin. We can see that for the past three months NMC has been flat and hovering around the 0.0024 figure. Let’s take a look at NMC/USD.
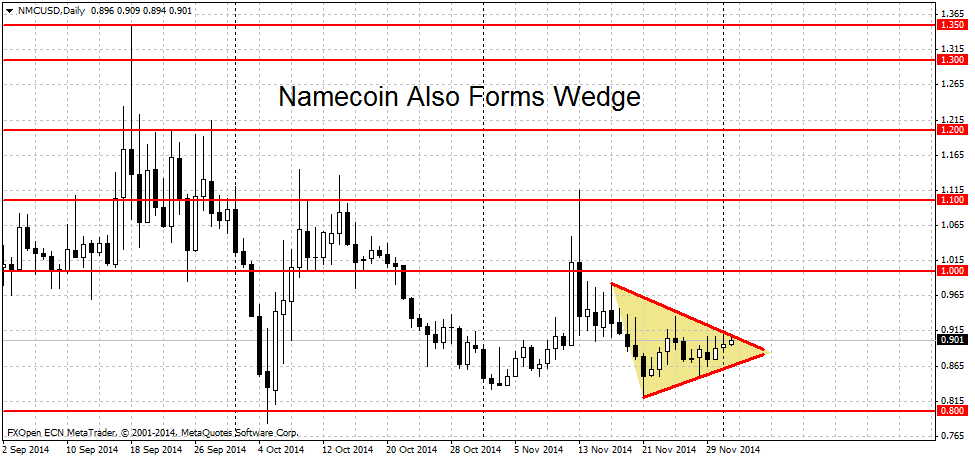
As you can probably guess, since NMC/BTC is essentially trading flat, the NMC/USD daily chart looks very similar to the BTC/USD daily chart. Here too we can see a wedge. The top of the wedge is currently at $0.92 and the bottom is at $0.866. Gains on the upside should be limited by the parity level. But a break above $1 per coin may trigger a NMC rally. On the downside, while a break below $0.85 may lead to some losses, the presence of several previous swing lows at $0.821, $0.832 and $0.783 should support prices. For a sustained move lower, look for a break of $0.75.
FXOpen offers the world's most popular cryptocurrency CFDs*, including Bitcoin and Ethereum. Floating spreads, 1:2 leverage — at your service. Open your trading account now or learn more about crypto CFD trading with FXOpen.
*At FXOpen UK and FXOpen AU, Cryptocurrency CFDs are only available for trading by those clients categorised as Professional clients under FCA Rules and Professional clients under ASIC Rules respectively. They are not available for trading by Retail clients.
This article represents the opinion of the Companies operating under the FXOpen brand only. It is not to be construed as an offer, solicitation, or recommendation with respect to products and services provided by the Companies operating under the FXOpen brand, nor is it to be considered financial advice.
Latest from Cryptocurrencies
Latest articles

What Order Imbalance Is and How To Use It in a Trading Strategy
Understanding the nuances of order imbalances is key for traders looking to navigate the ebb and flow of asset prices. Order imbalances provide a clear window into the supply and demand dynamics at play, offering strategic insights. This article delves

XAU/USD Gold Price Reaches an Important Resistance Zone
The XAU/USD gold chart today indicates that the historical record price of the metal is above USD 2,400 per ounce.
In addition to fears of a new round of inflation due to rising commodity prices, geopolitical tensions are

What Is a Break of Structure and How Can You Trade It?
In the ever-evolving world of Smart Money Concept (SMC) trading, a nuanced understanding of market dynamics is indispensable. This article explores the concept of Break of Structure (BOS), how to identify it, and its implications for trading strategies, setting traders