


FXOpen

AUD/USD started a decent recovery from the 0.6677 swing low and traded above 0.6750. Similarly, NZD/USD is now attempting an upside break above the 0.6500 resistance.
Important Takeaways for AUD/USD and NZD/USD
- The Aussie Dollar recovered nicely and settled above the 0.6750 resistance against the US Dollar.
- There was a break above a crucial bearish trend line with resistance near 0.6760 on the hourly chart of AUD/USD.
- NZD/USD also started an upside correction after a significant decline towards the 0.6380 level.
- There is a major bearish trend line forming with resistance near 0.6500 on the hourly chart.
AUD/USD Technical Analysis
Earlier this week, there was a strong decline in the Aussie Dollar below the 0.6750 and 0.6700 support levels against the US Dollar. The AUD/USD pair traded as low as 0.6677 and recently started a convincing upside correction.
The pair traded above the 0.6700 and 0.6750 resistance levels on FXOpen to move back in a positive zone. The upward move was positive since there was a close above 0.6750 and the 50 hourly simple moving average.
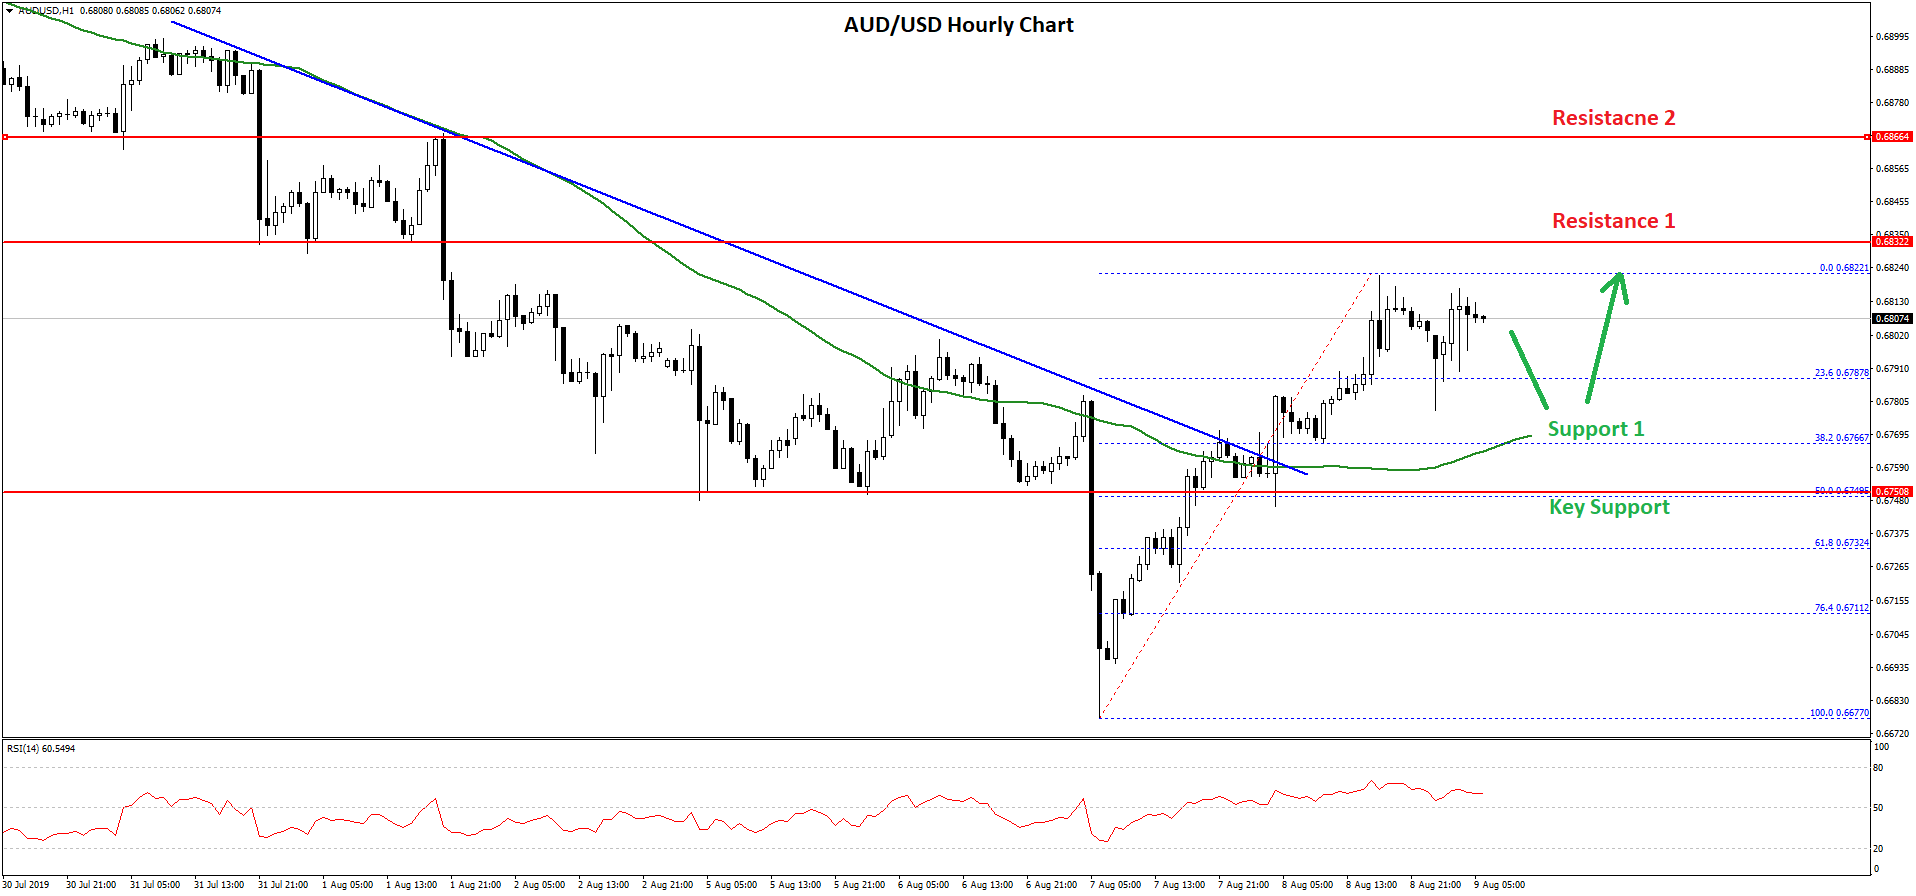
Besides, there was a break above a crucial bearish trend line with resistance near 0.6760 on the hourly chart of AUD/USD. It opened the doors for more gains above the 0.6800 resistance.
The pair traded as high as 0.6822 and it is currently consolidating gains. It tested the 23.6% Fib retracement level of the recent recovery from the 0.6677 low to 0.6822 high.
On the downside, there are many important supports near the 0.6780 and 0.6760 levels. Moreover, the 50% Fib retracement level of the recent recovery from the 0.6677 low to 0.6822 high is also near the 0.6766 level to act as a support.
The main support is near the 0.6750 level, below which AUD/USD might move back in a bearish zone. On the upside, the key resistances are near the 0.6820 and 0.6840 levels, above which the pair could climb back towards the 0.6900 level.
NZD/USD Technical Analysis
The New Zealand Dollar also followed a similar pattern and declined heavily earlier this week below the 0.6550 and 0.6500 support levels against the US Dollar. The NZD/USD pair even broke the 0.6400 level and traded to a new multi-week low at 0.6377.
Recently, it started an upside correction above the 0.6400 and 0.6420 resistance levels. Moreover, there was a break above the 0.6450 level and the 50 hourly simple moving average.
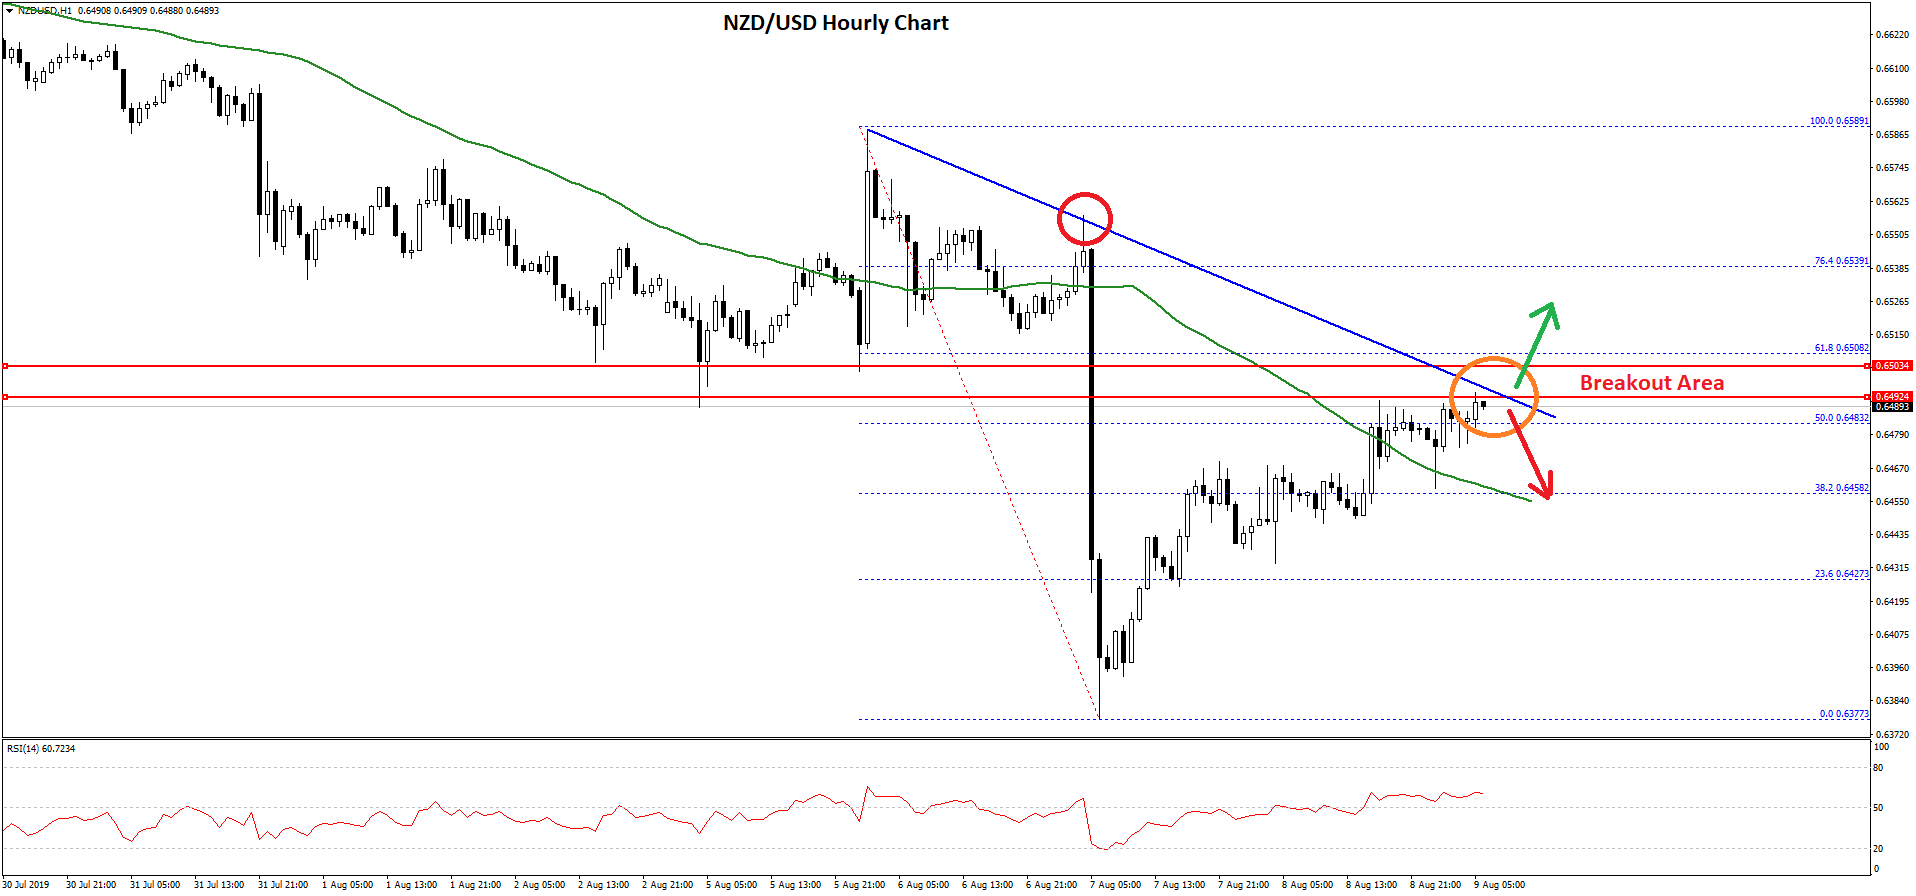
The pair is now trading above the 50% Fib retracement level of the last major decline from the 0.6589 high to 0.6377 low. However, the 0.6500 zone is acting as a significant resistance.
Additionally, there is a major bearish trend line forming with resistance near 0.6500 on the hourly chart. The 61.8% Fib retracement level of the last major decline from the 0.6589 high to 0.6377 low is also near the 0.6508 level.
Therefore, the pair has to surpass the 0.6500 and 0.6510 resistance levels to continue higher. The next key resistance is near the 0.6550 level.
Conversely, if there is no upside break above 0.6500 or 0.6510, the NZD/USD pair could decline once again. An immediate support is near the 0.6460 level, below which the pair could extend losses towards the 0.6420 and 0.6400 levels in the coming sessions.
Trade over 50 forex markets 24 hours a day with FXOpen. Take advantage of low commissions, deep liquidity, and spreads from 0.0 pips. Open your FXOpen account now or learn more about trading forex with FXOpen.
This article represents the opinion of the Companies operating under the FXOpen brand only. It is not to be construed as an offer, solicitation, or recommendation with respect to products and services provided by the Companies operating under the FXOpen brand, nor is it to be considered financial advice.
Stay ahead of the market!
Subscribe now to our mailing list and receive the latest market news and insights delivered directly to your inbox.


Latest articles

BTC/USD Analysis: Bitcoin Price at a Critical Support Level
In our 28 January report, "Bitcoin Price Holds Above $100k. For Now?", we highlighted the heightened volatility surrounding Trump’s inauguration. We speculated that major market players might have capitalized on this surge to lock in profits from long positions,

Analytical NVIDIA Stock Price Predictions for 2025-2030 and Beyond
NVIDIA has become a dominant force in technology, driving innovation in AI, data centres, and next-generation computing. Its stock has seen substantial growth, becoming a key player for investors to watch closely.
This article breaks down NVIDIA’s stock forecasts

Analytical Tesla Stock Predictions for 2025 – 2030 and Beyond
Tesla has been at the forefront of the electric vehicle revolution, capturing the imagination of investors and the general public alike since the launch of the Roadster in 2008. From the debut of the Model S to the unveiling of