


FXOpen

AUD/USD declined heavily in July 2019 and found support near 0.6680 in August 2019. Similarly, NZD/USD remained in a bearish zone below 0.6500. Both pairs might correct higher, but upsides are likely to remain capped.
Important Takeaways for AUD/USD and NZD/USD
- The Aussie Dollar declined to a new multi-month low near 0.6677 against the US Dollar.
- There is a crucial bearish trend line forming with resistance near 0.7000 on the daily chart of AUD/USD.
- NZD/USD also traded to a new multi-month low near 0.6268 and remains in a bearish zone.
- There are many key resistances forming near the 0.6500 level on the daily chart.
AUD/USD Technical Analysis
In July 2019, the Aussie Dollar broke a major support area near the 0.6860 level against the US Dollar. The AUD/USD pair declined heavily and settled below the 0.6900 and 0.6860 support levels.
Moreover, there was a break below the 0.6800 level and the pair settled well below the 50-day simple moving average. A new multi-month low was formed near 0.6677 on FXOpen and the pair started forming a decent support base in August 2019.
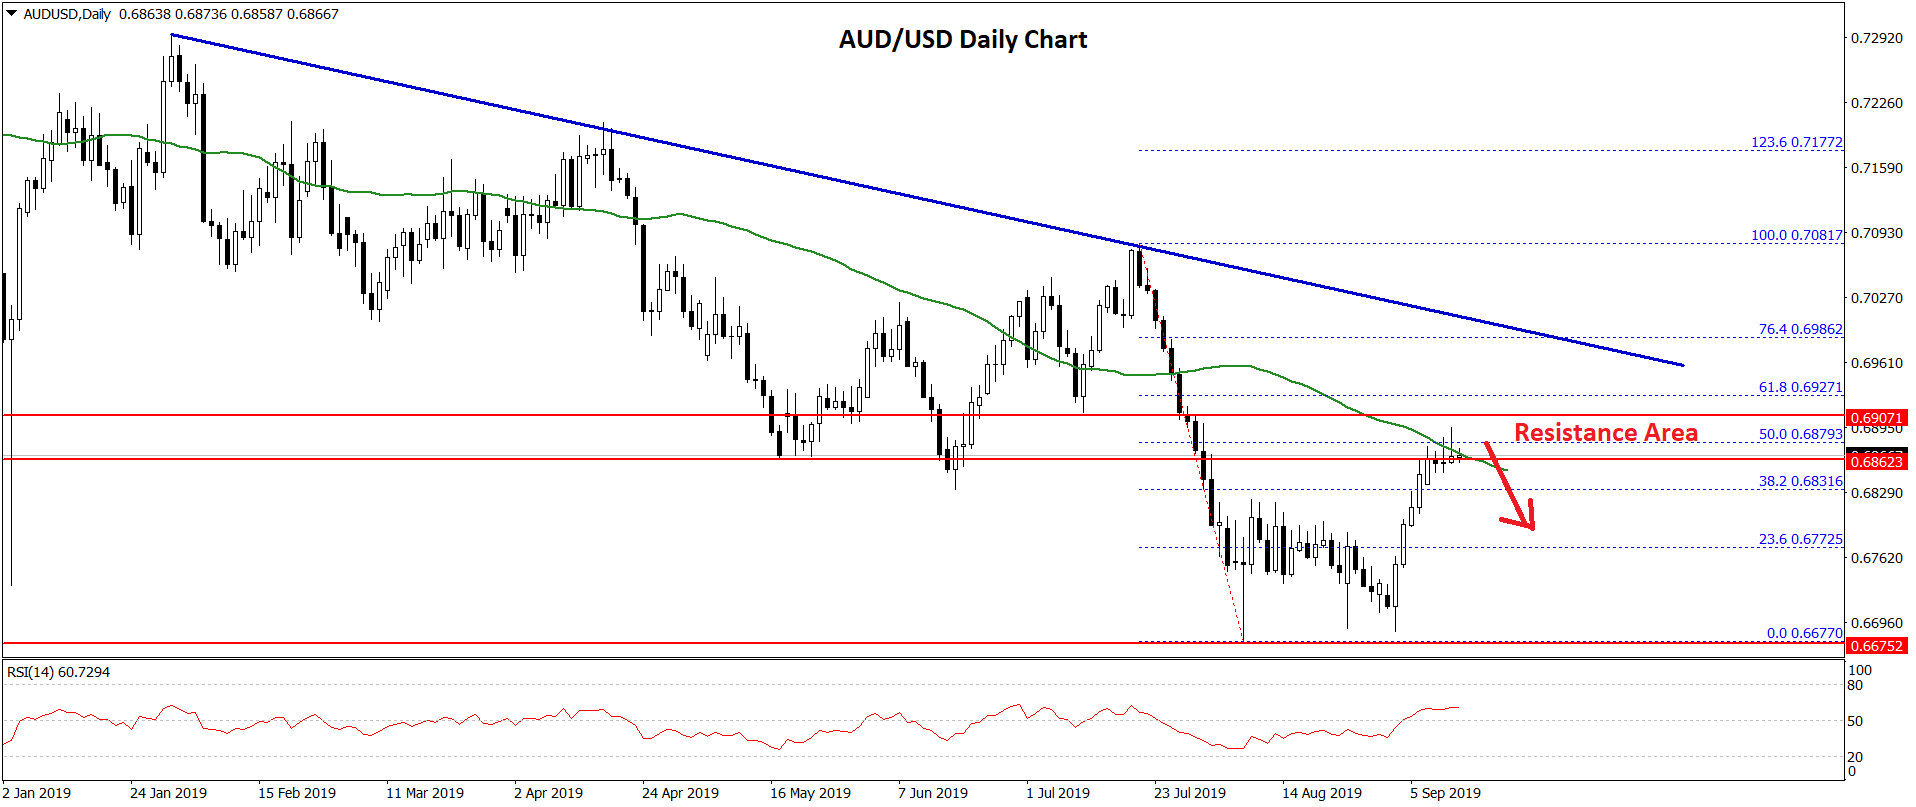
Recently, it climbed above the 0.6750 resistance and the 23.6% Fibonacci retracement level of the last major decline from the 0.7081 high to 0.6677 swing low.
However, there are many resistances forming on the upside near the 0.6850 and 0.6860 levels. More importantly, the 50-day simple moving average is positioned near the 0.6880 level.
The 50% Fibonacci retracement level of the last major decline from the 0.7081 high to 0.6677 swing low is also near the 0.6880 level. Finally, there is a crucial bearish trend line forming with resistance near 0.7000 on the daily chart of AUD/USD.
Therefore, upsides are likely to face a strong resistance near the 0.6860, 0.6880 and 0.7000 levels. Only a successful daily close above 0.7000 might start a strong recovery towards the 0.7200 level.
On the downside, the key supports are 0.6720 and 0.6680, below which the pair may perhaps decline extend its decline towards the 0.6600 and 0.6550 levels.
NZD/USD Technical Analysis
The New Zealand Dollar also followed a similar pattern and declined below the 0.6600 and 0.6550 support levels against the US Dollar. The NZD/USD pair even traded below the 0.6400 support level to enter a prolonged downtrend.
Moreover, there was a break below 0.6350 pivot level and the pair settled well below the 50-day simple moving average. A new multi-month low was formed near 0.6268 and the pair recently stared a short term upside correction.
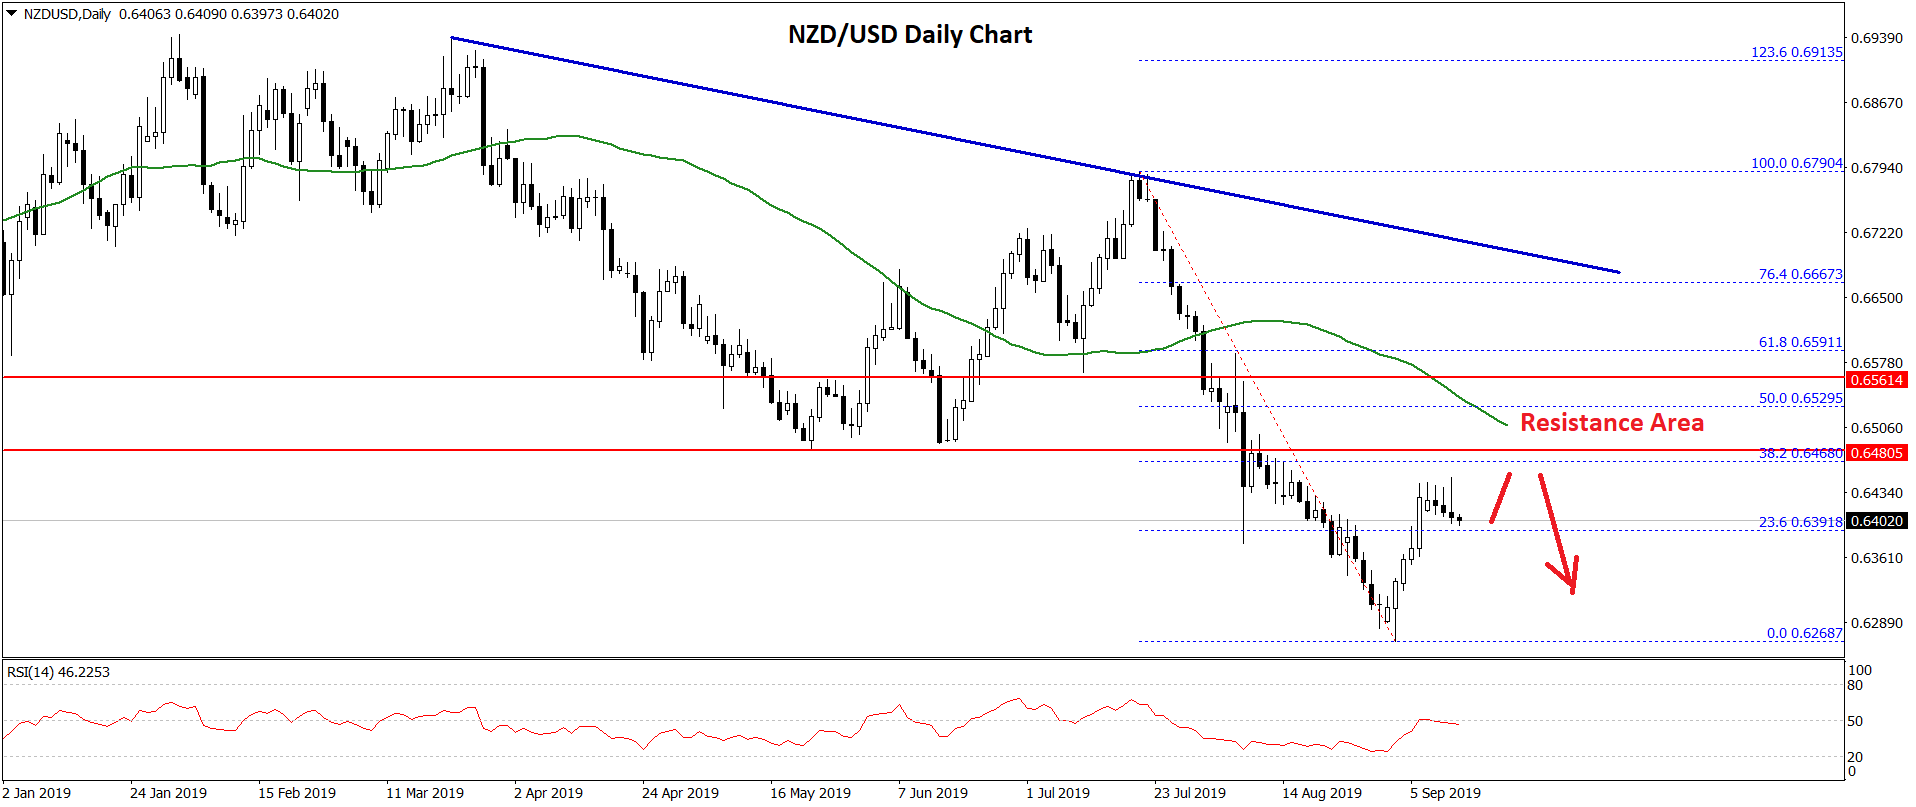
An immediate resistance on the upside is near the 0.6400 level and the 23.6% Fibonacci retracement level of the last major decline from the 0.6790 high to 0.6268 swing low.
However, the main resistance on the upside is near the 0.6500 level (the previous support area). Moreover, it coincides with the 38.2% Fibonacci retracement level of the last major decline from the 0.6790 high to 0.6268 swing low.
Therefore, an upside correction from the current levels could face a lot of hurdles near 0.6400 and 0.6500. A successful close above 0.6500 could start a solid recovery towards the 0.6700 resistance.
On the downside, the recent low near the 0.6270 level is a decent support, below which NZD/USD might decline towards the 0.6200 and 0.6150 support levels.
Trade over 50 forex markets 24 hours a day with FXOpen. Take advantage of low commissions, deep liquidity, and spreads from 0.0 pips. Open your FXOpen account now or learn more about trading forex with FXOpen.
This article represents the opinion of the Companies operating under the FXOpen brand only. It is not to be construed as an offer, solicitation, or recommendation with respect to products and services provided by the Companies operating under the FXOpen brand, nor is it to be considered financial advice.
Stay ahead of the market!
Subscribe now to our mailing list and receive the latest market news and insights delivered directly to your inbox.


Latest articles

BTC/USD Analysis: Bitcoin Price at a Critical Support Level
In our 28 January report, "Bitcoin Price Holds Above $100k. For Now?", we highlighted the heightened volatility surrounding Trump’s inauguration. We speculated that major market players might have capitalized on this surge to lock in profits from long positions,

Analytical NVIDIA Stock Price Predictions for 2025-2030 and Beyond
NVIDIA has become a dominant force in technology, driving innovation in AI, data centres, and next-generation computing. Its stock has seen substantial growth, becoming a key player for investors to watch closely.
This article breaks down NVIDIA’s stock forecasts

Analytical Tesla Stock Predictions for 2025 – 2030 and Beyond
Tesla has been at the forefront of the electric vehicle revolution, capturing the imagination of investors and the general public alike since the launch of the Roadster in 2008. From the debut of the Model S to the unveiling of