


FXOpen
AUD/USD started a strong upward move and recently tested the 0.7000 resistance. NZD/USD also climbed higher and is currently correcting gains. However, dips remain supported for a fresh increase.
Important Takeaways for AUD/USD and NZD/USD
- The Aussie Dollar started a solid upward move after it broke the 0.6940 resistance against the US Dollar.
- There is a breakout pattern forming with support near the 0.6965 level on the hourly chart of AUD/USD.
- NZD/USD climbed higher recently and broke the key 0.6600 resistance area.
- It is currently correcting lower and broke a bullish trend line with support near 0.6625 on the hourly chart.
AUD/USD Technical Analysis
After forming a support base near the 0.6900 level, the Aussie Dollar started a strong upward move against the US Dollar. The AUD/USD pair broke the key 0.6920 and 0.6950 resistance levels to move into a positive zone.
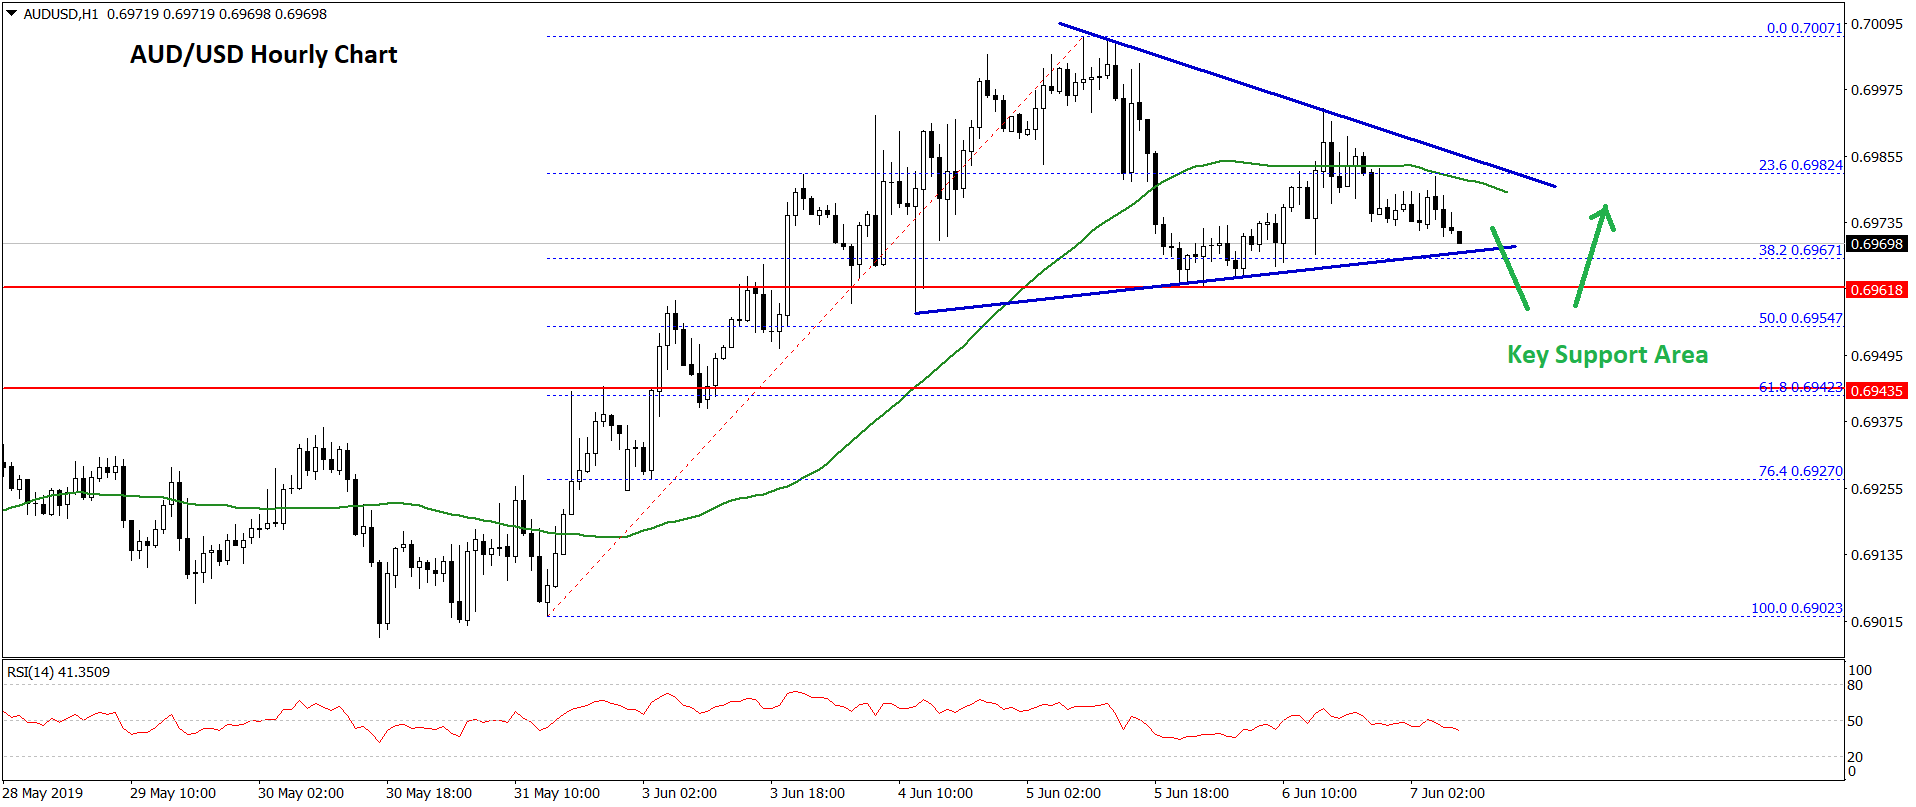
The hourly chart suggests that the pair gained momentum above 0.6950 and the 50 hourly simple moving average. It even broke the 0.6980 level and spiked above the 0.7000 level.
A swing high was formed at 0.7007 before the pair started a downside correction. There was a break below the 23.6% Fib retracement level of the last wave from the 0.6902 low to 0.7007 high.
The price action was such that the pair even corrected below the 0.6980 level and the 50 hourly SMA. There is also a breakout pattern forming with support near the 0.6965 level on the hourly chart of AUD/USD.
It seems like there could be a downside spike below 0.6970 before the pair could start a fresh increase. The main support is near the 0.6950 and 0.6940 levels. The 50% Fib retracement level of the last wave from the 0.6902 low to 0.7007 high is also near the 0.6955 level to act as a support.
On the upside, an initial resistance is near the 0.6985 level. However, the main resistances on the upside are near the 0.7000 and 0.7020 levels.
NZD/USD Technical Analysis
The New Zealand Dollar also gained momentum this week and broke the key 0.6600 resistance against the US Dollar. The NZD/USD pair even traded above 0.6650 and formed a swing high at 0.6666.
Recently, it started a downside correction below the 0.6640 and 0.6620 support levels. There was also a break below the 23.6% Fib retracement level of the last wave from the 0.6497 low to 0.6666 high.
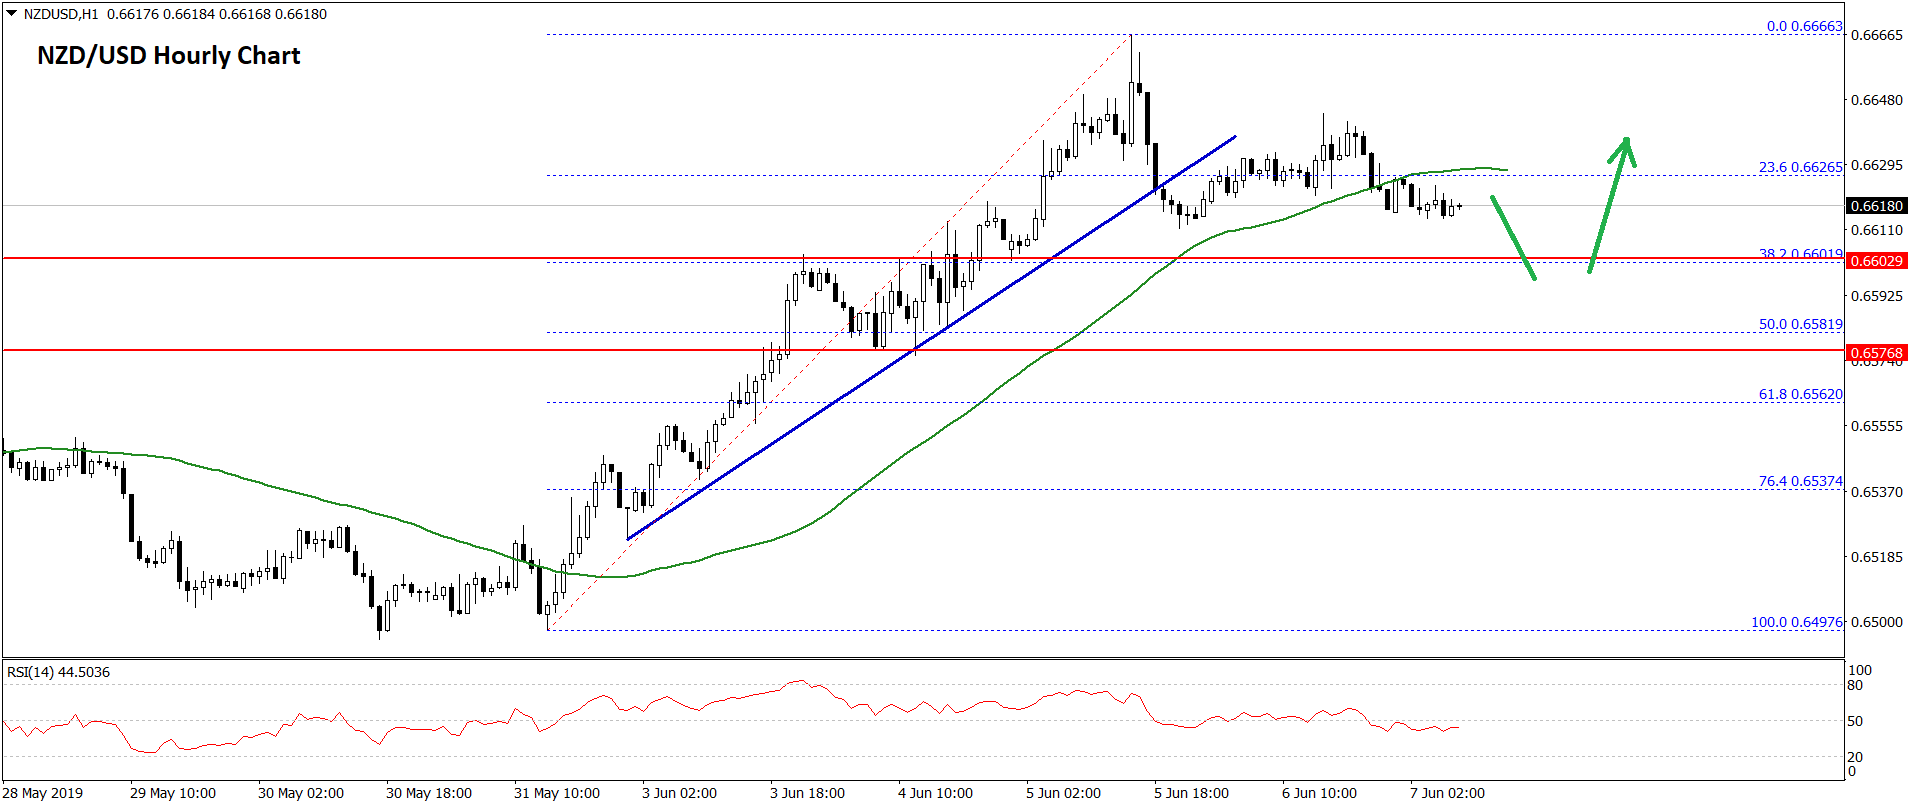
There was also a break below a major bullish trend line with support near the 0.6625 level on the hourly chart. The pair is now trading below the 0.6625 level and the 50 hourly simple moving average.
An immediate support is near the 0.6600 level and the 38.2% Fib retracement level of the last wave from the 0.6497 low to 0.6666 high.
If there are more losses below the 0.6600 level, there are chances of extended declines. The next main support is near the 0.6580 level and the 50% Fib retracement level of the last wave from the 0.6497 low to 0.6666 high.
The overall price action is positive and it seems like there could be more upsides above the 0.6650 level. A clear break above 0.6650 might push the price above 0.6660.
Trade over 50 forex markets 24 hours a day with FXOpen. Take advantage of low commissions, deep liquidity, and spreads from 0.0 pips. Open your FXOpen account now or learn more about trading forex with FXOpen.
This article represents the opinion of the Companies operating under the FXOpen brand only. It is not to be construed as an offer, solicitation, or recommendation with respect to products and services provided by the Companies operating under the FXOpen brand, nor is it to be considered financial advice.
Latest from Forex Analysis
Latest articles

Google Share Price Rose Post-market to a New All-time Record
Yesterday, after the close of the main trading session, a report on activities for the 1st quarter of Alphabet Inc. (Google's parent company) was published. The report was strong, exceeding investors' expectations.
→ Quarterly EPS = USD 1.89 (expected = USD 1.

S&P 500 Rebounds after Negative GDP News
Data released yesterday showed US GDP growth slowed to 1.6% in the first quarter of the year. According to ForexFactory: forecast = 2.2%, past value = 2.4%.
Reaction to the news sent the S&P 500 mini stock

GBP/USD And USD/CAD Daily Chart Outlook
GBP/USD is attempting a recovery wave from 1.2300. USD/CAD is consolidating and might aim for a move above the 1.3760 resistance zone.
Important Takeaways for GBP/USD and USD/CAD Analysis Today
· The British Pound started