


FXOpen
AUD/USD is currently struggling to gain bullish momentum above the 0.7220 resistance. NZD/USD is also facing hurdles and it may correct lower in the near term.
Important Takeaways for AUD/USD and NZD/USD
- The Aussie Dollar recovered recently and traded above the 0.7170 resistance against the US Dollar.
- There is a major bearish trend line in place with resistance at 0.7210 on the hourly chart of AUD/USD.
- NZD/USD is also facing a crucial bearish trend line with resistance near 0.6780 on the hourly chart.
- The pair may decline a few points towards the 0.6740 or 00.6730 support levels.
AUD/USD Technical Analysis
Recently, there was a downside move below the 0.7170 support in the Aussie Dollar against the US Dollar. The AUD/USD pair even traded below the 0.7160 level before buyers appeared near 0.7145.
A low was formed at 0.7146 on FXOpen and later the pair started a decent upside correction. It climbed above the 0.7170 and 0.7180 resistance levels, plus there was a close above the 50 hourly simple moving average.
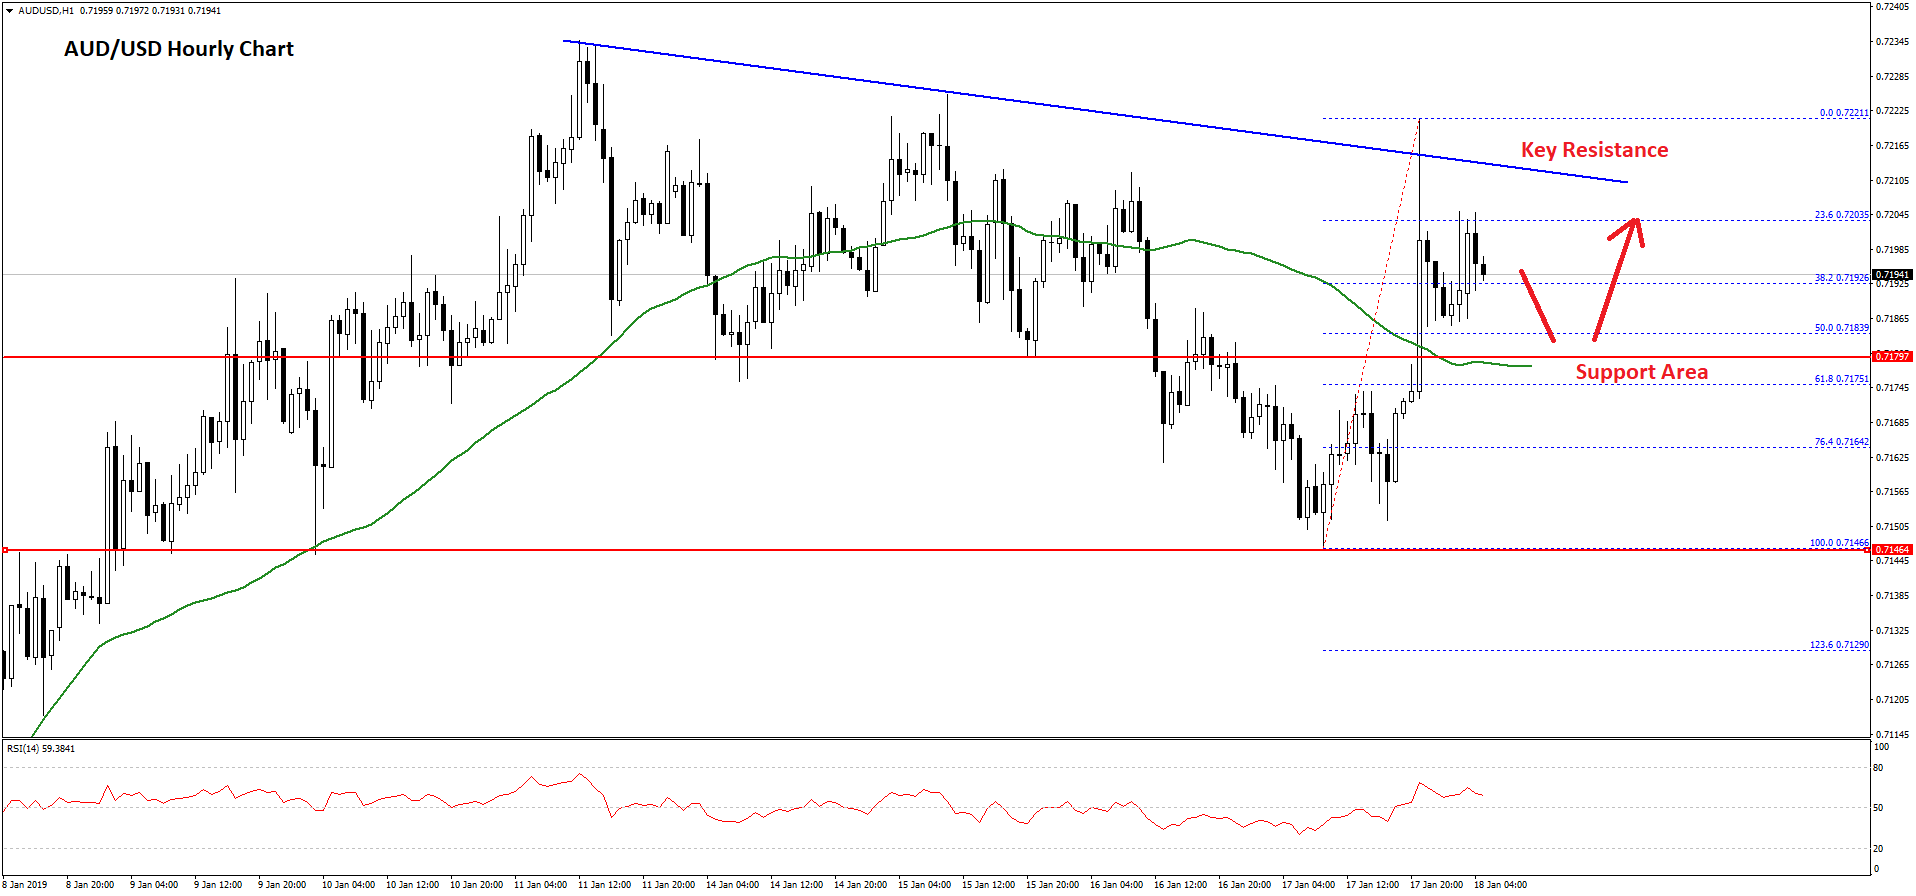
However, the pair struggled to gain traction above the 0.7220 resistance and topped near the 0.7221 level. The pair corrected below the 0.7200 level and the 23.6% Fib retracement level of the recent wave from the 0.7146 low to 0.7221 high.
On the downside, there are many key supports near the 0.7170 and 0.7180 levels. The 50% Fib retracement level of the recent wave from the 0.7146 low to 0.7221 high is also near the 0.7183 level.
Besides, the 50 hourly simple moving average is positioned near the 0.7180 level. Therefore, the pair is likely to bounce back if it declines towards the 0.7170 or 0.7180 support levels.
On the upside, there is a crucial resistance near 0.7200 and a major bearish trend line in place with resistance at 0.7210 on the hourly chart of AUD/USD. A close above 0.7210 and 0.7220 is needed for more gains in the near term. If not, the pair may slide back towards 0.7140.
NZD/USD Technical Analysis
The New Zealand Dollar started a major downward move from the 0.6850 swing high against the US Dollar. The NZD/USD pair broke the 0.6800 and 0.6780 support levels to move into a bearish zone.
There was even a break below the 0.6750 level and the 50 hourly simple moving average. The pair traded as low as 0.6727 and later started an upside correction. It moved above the 38.2% Fib retracement level of the recent decline from the 0.6848 high to 0.6727 low.
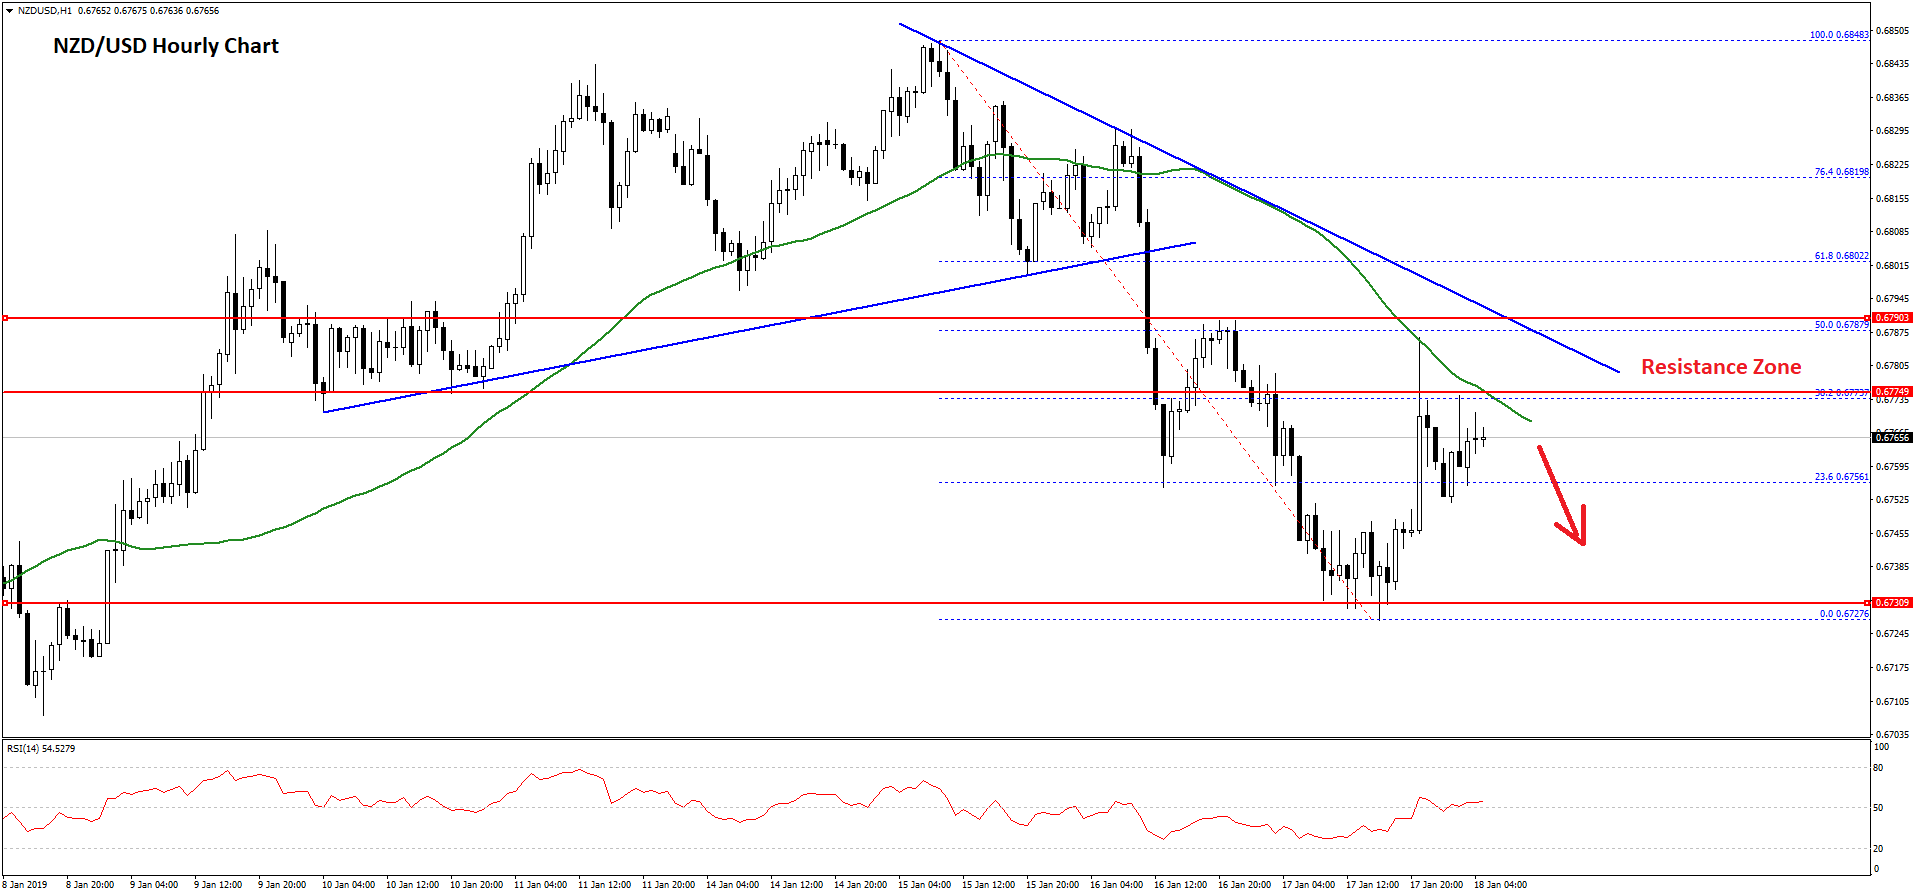
However, the pair struggled to gain momentum above the 0.6780 level and the 50 hourly simple moving average. Moreover, there is a crucial bearish trend line with resistance near 0.6780 on the hourly chart.
Finally, the 50% Fib retracement level of the recent decline from the 0.6848 high to 0.6727 low is near 0.6787. Therefore, it won’t be easy for buyers to clear the 0.6780 and 0.6800 hurdles in the near term.
As long as the pair is trading below the 0.6780 and 0.6800 resistance levels, there is a risk of a fresh decline towards the 0.6750 or 0.6730 support levels in the near term.
Trade over 50 forex markets 24 hours a day with FXOpen. Take advantage of low commissions, deep liquidity, and spreads from 0.0 pips. Open your FXOpen account now or learn more about trading forex with FXOpen.
This article represents the opinion of the Companies operating under the FXOpen brand only. It is not to be construed as an offer, solicitation, or recommendation with respect to products and services provided by the Companies operating under the FXOpen brand, nor is it to be considered financial advice.
Latest from Forex Analysis
Latest articles

Anchored VWAP and How You Can Use It in Forex Trading
In the world of forex trading, understanding the nuanced tools at your disposal can significantly enhance decision-making processes. One such sophisticated tool is the Anchored Volume-Weighted Average Price (Anchored VWAP), which refines the standard VWAP by allowing traders to set

META Share Price Collapses after Publication of Quarterly Report
Just yesterday, META's stock price closed at USD 493.50, up approximately 40% since the start of 2024 and up nearly 300% since the start of 2023.
However, following the release of Meta's quarterly report, its shares plummeted to USD

USD/JPY Analysis: The Rate Exceeds The Level of 155 Yen Per US Dollar
Today, the price of USD/JPY once again renewed its 34-year high, exceeding the level of 155 yen per dollar, which put pressure on the current authorities.
According to Reuters, officials are trying to maintain calm in the market.
"We